Download
1 / 16
170 likes | 207 Views
Explore the methods used in localizing stops along a proposed light rail transit line and planning mixed land use with high density. Learn how these tools help balance development around transit stops and optimize transit usage while maintaining quality neighborhoods.

E N D
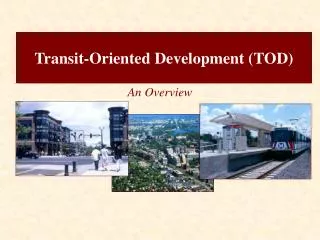
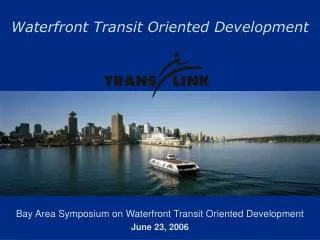
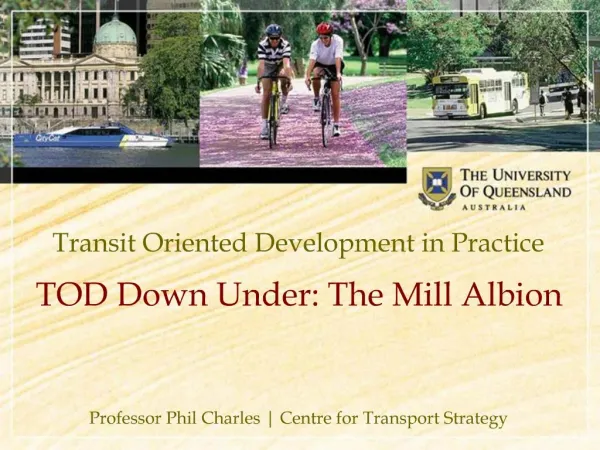
Stavanger – optimal transit oriented development? Methods used for the localisation of stops along a proposed light rail transit (LRT) line and in the planning of mixed land use and high density. Anders Langeland
The concept, and what is measured The instrument is a method that can be used to determine optimal stops along a planned LRT line according to two criteria: The number of homes and workplaces within a specified distance. The development potential measured in square meters (both dwellings and workplaces) within the same specified distances or contours from the stop.
Previous application of this instrument in planning practice The method has been used ad hoc for decades as one of the tools in spatial planning. GIS has made it possible to use the method more extensively. The LRT in Stavanger (Bybanen) is at the moment undergoing strategic assessment at the national level. The planners responsible for LRT planning intend to use the instrument during the more detailed planning the next couple of years.
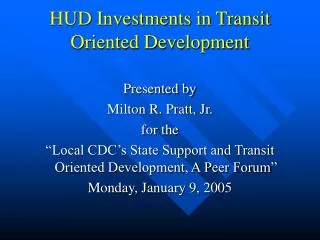
Relevance and usefulness for planning practice This is a tool which helps planners to balance mixed land use development at transit stops with the need for optimizing transit usage and still maintaining high quality neighborhoods and public space. There are very mixed results from planning of increased density around transit stops due to many factors such as land ownership, investors with capital, etc. The instrument will be helpful for planners in assessing these different factors and put forward a balanced plan for each stop.
Lessons to be learnt The instrument has the potential to produce knowledge which may be used to make more balanced land use plans and join up the land use plan with the transport plan in a better way than traditionally has been done.
Method for arriving at maximum recommendable size of shopping centres Aud Tennøy The instrument is a method applied by the planning authorities in Oslo in cases where developers propose zoning plans for retail centres. The planning authorities apply the method in order to calculate maximum size of the centres, with the basis in the number of people living in walking and bicycling distance from the proposed centre. What is measured is the number of people living within one and two kilometres real walking distance from the site for the proposed centre.
Previous application in planning practice The number of people who live within one km and two km real walking distance of the site today and in 2025 (GIS). The future turnover of the centre was calculated based on this. Turnover (NOK) within walking and bicycling distance = number of people ( 1 km and between 1 and 2 km ) x percentages of spending at this centre(%) x spending per persons in such centres Centre size (m2) = Turnover (NOK) within walking and bicycling distance/Average turnover in similar centres (NOK/m2)
Relevance and usefulness for planning practice This is a tool which helps planning authorities to dimensioning new retail centers (land use) so that travel demands for shopping and services and car dependence are minimized.
Lessons learnt ? The planning authorities claim that this method is understandable, transparent and requires less work than other methods. Hence, all involved parties can apply it and contribute in the discussions regarding retail development.
THE STAVANGER REGION 4 municipalities, 3rd largest urban area, 250.000 persons The challenge next twenty years or so, 40% growth: + 100.000 persons + 80.000 cars
The best agricultural area in Norway. The highest incomes and most ”americanised” area. CARS 72 % PT 8 % BIKE 7 % WALKING 12 %
Studyarea 2008: 35% of the number of PT trips in Basic Structure BYBANEN LRT proposed, Euro 800 million, 27 km Basic Structure