Download
1 / 9
120 likes | 468 Views
An Intro to Bar Graphs. By: Halee Kim, Alden Ford, Amy Yu, and Jen Zhang. Bar Graph: what is it?. A bar graph is a diagram in which the numerical values of variables are represented by the height or length of lines or rectangles of equal width.

E N D
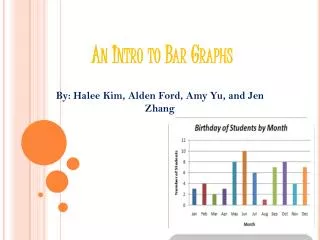
An Intro to Bar Graphs By: Halee Kim, Alden Ford, Amy Yu, and Jen Zhang
Bar Graph: what is it? • A bar graph is a diagram in which the numerical values of variables are represented by the height or length of lines or rectangles of equal width. • In other words, a bar graph is simply a chart with bars that have lengths proportional to numerical quantities. The bars can be horizontal or vertical. • A bar graph is a way to organize categorical data. • Necessary data to make a bar graph: independent and dependent variables and a single set of data.
use a bar graph when… • Comparing the numbers of several different things at a specific point in time • Showing CHANGES OVER TIME • Combining groups and time periods together into a graph • Tracking and comparing several items in accordance with two or more groups of people • Graphing RELATIVE FREQUENCY • You should NOT use bar graphs if you’re comparing something to a larger whole, or to show proportion.
Real world example of a bar graph • This graph is used in a real life situation when a new school is trying to decide what sport programs they should include in the fifth grade sports division. • This data is able to be put in a bar graph because it is a single set of data from a sample and it makes it easy to analyze which sports are more favorable than others.
Our real world example (class survey) This is a sample graph.
The big question • Students in our class have taken a survey on what their top 5 candies are. The cafeteria wants to know the top 3 candies out of the 10 possible choices to put in the snack bar based on the survey. They have to spend $300. How much will they spend on Hershey Bars based on this graph? ANSWER: Hershey Bars: $94.12
Advantages of a bar graph • It immediately lets you see the data (top 5 favorite candies). • It’s a great way of comparing data because the values of each category (candies) are easily seen side-by-side.
Disadvantages of a bar graph • The exact data in numbers may not be apparent or easily seen (because when it’s in bar graph form, the data looks slightly averaged) • It is hard to express a linear equation with a bar graph.
Sources used in this project • Slide 1 picture of a bar graph: http://wikieducator.org/images/c/c7/Bargraph.jpg • Slide 2 (bar graph definition): https://www.google.com/#hl=en&tbo=u&q=bar+graph&tbs=dfn:1&sa=X&ei=ipEZUf_pL-2J0QGU4YCIBg&ved=0CC8QkQ4&bav=on.2,or.r_gc.r_pw.r_cp.r_qf.&bvm=bv.42080656,d.dmQ&fp=d2e72972d76bf84c&biw=855&bih=479 • Slide 3: http://www.ehow.com/how_4578142_bar-graph-best-be-used.html#page=0 (when to use bar graphs) • Slide 4: http://studyzone.org/testprep/math4/d/bargraph4l.cfm (graph)