Bar Graphs
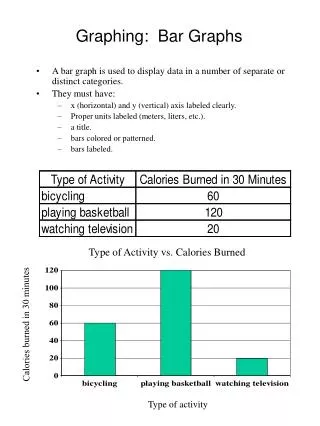
Bar Graphs. WHY WE USE BAR GRAPHS?????. Bar graphs are used to organize data. They show how something changes over time or to compare items. There are two main types. 1. Horizontal Bar Graphs. 2. Vertical Bar Graphs. . Titles!!!.


Bar Graphs
E N D
Presentation Transcript
WHY WE USE BAR GRAPHS????? • Bar graphs are used to organize data. • They show how something changes over time or to compare items. • There are two main types. • 1. Horizontal Bar Graphs. • 2. Vertical Bar Graphs.
Titles!!! • All graphs must have a title. • They usually go at the top. • Titles tell us what the graph is about. • Example. How Long Can Animals Hold Their Breath?
X Axis. • X axis is always horizontal. • Has numbers for time periods or for what is being measured. • Example. Number of Minutes.
Y Axis. • Y axis is always vertical. • It has numbers for the amount of stuff being measured. • Example = Types of Animals