Download
1 / 54
550 likes | 828 Views
Chapter 2 Supply and Demand. Introduction. The model of supply and demand is one of the most important tools in economics. The model is a simple presentation of exchange that captures the behavior of both buyers and sellers. The Demand Curve for Oil.

E N D
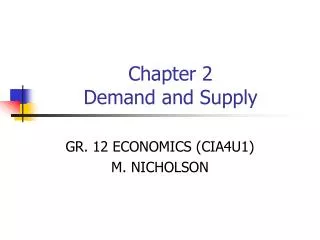
Chapter 2 Supply and Demand
Introduction The model of supply and demand is one of the most important tools in economics. The model is a simple presentation of exchange that captures the behavior of both buyers and sellers.
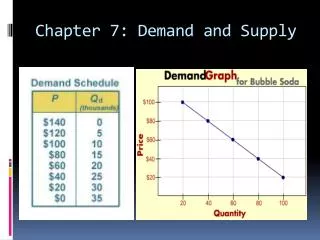
The Demand Curve for Oil Demand represents the behavior of buyers. A Demand Curve is a function that shows the quantity demanded at different prices. The Quantity Demanded is the quantity that buyers are willing and able to purchase at a particular price.
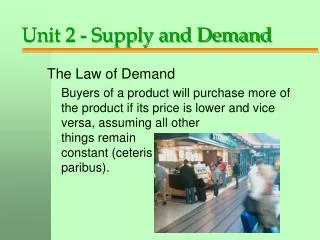
The Demand Curve for Oil The Law of Demand indicates an inverse relationship between price and quantity demanded. When price rises, all else equal, quantity demanded falls. When price falls, all else equal, quantity demanded rises. Demand curves consistent with the law of demand are downward sloping.
Demand Curves The Demand Curve for Oil is a Function Showing the Quantity of Oil Demanded at Different Prices Price of Oil per Barrel $55 $20 $5 Demand Quantity of Oil (MBD) 5 25 50
Demand Curves Demand curves can be read in two ways: Horizontally: How much buyers are willing and able to purchase at a given price. Vertically: The maximum price for which buyers are willing to pay for a given quantity. Demand curves thus reveal the quantity demanded at a given price or the maximum willingness to pay for a given quantity.
The Demand Curve for Oil Horizontal Reading Price of Oil per Barrel $55 $20 Start Demand $5 Quantity of Oil (MBD) 5 25 50 End
The Demand Curve for Oil Vertical Reading Price of Oil per Barrel $55 $20 End Demand $5 Quantity of Oil (MBD) 5 25 50 Start
Demand Curves Why is the demand curve downward sloping? A good is not equally valuable in all of its uses. At a high price, a good is consumed in only its highest valued use. At a low price, a good is also consumed in its lower valued uses. The value of a good’s use will depend on the availability of substitutes.
The Demand Curve for Oil When the price of oil is high, oil will only be used in higher valued uses. As the price falls, oil will also be used in lower valued uses Price of Oil per Barrel Higher Valued Uses of Oil $120 Lower Valued Uses of Oil $20 Demand Quantity of Oil (MBD) 20 120
Consumer Surplus Consumer Surplusis the consumer’s gain from exchange, or the difference between the maximum price a consumer is willing to pay for a given quantity and the market price. Total consumer surplus is the sum of consumer surplus of all buyers. Graphically, total consumer surplus is measured by the area below the demand curve and above the price.
Consumer Surplus Consumer Surplus is the Area beneath the Demand Curve and above the Price Price of Oil per Barrel Area of Triangle Height The President’s Consumer Surplus 80 Total Consumer Surplus at a Price of $20 ½(Base x Height) Base Joe’s Consumer Surplus ½(80-20)x90 = $2,700 20 Demand Quantity of Oil (MBD) 90
What Shifts the Demand Curve? The demand curve An increase in demand means that quantity demanded at a given price increases, or the maximum willingness to pay for a given quantity rises. Graphically, an increase in demand shifts the demand curve outwards, up, and to the right. A decrease in demand means that quantity demanded at a given price decreases, or the maximum willingness to pay for a given quantity falls. Graphically, a decrease in demand shifts the demand curve inwards, down, and to the left.
Change in Demand An Increase in Demand Price per Unit Greater Willingness to Pay for the Same Quantity $50 Greater Quantity Demanded at the Same Price $25 New Demand Old Demand Quantity 80 70
Change in Demand A Decrease in Demand Price per Unit Lower Willingness to Pay for the Same Quantity $50 Less Quantity Demanded at the Same Price $25 Old Demand Curve New Demand Curve Quantity 70 80
Important Demand Shifters Important Demand Shifters Income Population Price of Substitutes Price of Complements Expectations Tastes
Important Demand Shifters - Income The effect of changes in income on demand depends on the nature of the good in question. A Normal Goodis a good for which demand increases (decreases) when income increases (decreases). An Inferior Goodis a good for which demand decreases (increases) when income increases (decreases).
Important Demand Shifters - Population As the population of an economy changes, the number of buyers of a particular good also changes, directly influencing its demand. More buyers of a good increases its demand. Fewer buyers of a good decreases its demand.
Important Demand Shifters - Price of Substitutes Two goods are Substitutes if a decrease (increase) in the price of one good leads to a decrease (increase) in demand for the other good.
Important Demand Shifters - Price of Complements Two goods are Complements if a decrease (increase) in the price of one good leads to an increase (decrease) in the demand for the other.
Important Demand Shifters - Expectations The expectation of a higher (lower) price for a good in the future increases (decreases) current demand for the good. Consumers will adjust their current spending in anticipation of the direction of future prices in order to obtain the lowest possible price.
Important Demand Shifters - Tastes Tastes and preferences are subjective and will vary among consumers. Some issues like seasonal changes or fads, however, will have rather predictable effects on demand.
What Shifts the Demand Curve? A change in quantity demandedis NOT the same as a change in demand. Quantity demanded changes only when the price of a good changes. Graphically, a change in quantity demanded is represented by a movement along a fixed demand curve. Demand changes only when a non-price factor (demand shifter) changes. Graphically, a change in demand is represented by a shift in the entire demand curve.
Economic growth in India is raising the incomes of Indian workers. What do you predict will happen to the demand for automobiles? What about the demand for charcoal bricks for home heating? • As the price of oil rises, what do you predict will happen to the demand for mopeds?
The Supply Curve for Oil Supply represents the behavior of sellers. A Supply Curveis a function that shows the quantity supplied at different prices. The Quantity Suppliedis the quantity that producers are willing and able to sell at a particular price.
The Supply Curve for Oil The Law of Supplyindicates a direct relationship between price and quantity supplied. When price rises, all else equal, quantity supplied rises. When price falls, all else equal, quantity supplied falls. Supply curves consistent with the law of supply are upward sloping.
Supply Curves The Supply Curve for Oil is a Function Showing the Quantity of Oil Supplied at Different Prices Price of Oil per Barrel Supply Curve for Oil $55 $20 $5 Quantity of Oil (MBD) 10 50 30
Supply Curves Supply curves can be read in two ways: Horizontally: How much suppliers are willing and able to sell at a given price. Vertically: The minimum price for which suppliers are willing to sell a given quantity. Supply curves, thus, reveal the quantity supplied at a given price, or the minimum price at which suppliers will sell a given quantity.
The Supply Curve for Oil Horizontal Reading Price of Oil per Barrel Supply Curve for Oil $55 Start $20 $5 Quantity of Oil (MBD) 10 30 50 End
Supply Curves Vertical Reading Price of Oil per Barrel Supply Curve for Oil $55 End $20 $5 Quantity of Oil (MBD) 10 30 50 Start
Supply Curves Why is the supply curve upward sloping? The cost of producing a good is not equal across all suppliers. At a low price, a good is produced and sold only by the lowest cost suppliers. At a high price, a good is also produced and sold by higher cost suppliers.
The Supply Curve for Oil The Supply Curve for Oil Price of Oil per Barrel Supply $60 Oil Shale Profitable Here $40 Higher Cost Oil Low Cost Oil $20 Quantity of Oil (MBD) 20 40 60 80 100
ProducerSurplus Producer Surplusis the producer’s gain from exchange, or the difference between the market price and the minimum price at which producers would be willing to sell a given quantity. Total producer surplus is the sum of the producer surplus of each seller. Graphically, total producer surplus is measured by the area above the supply curve and below the price.
Producer Surplus Producer Surplus is the Area Above the Supply Curve and Below the Price Price of Oil per Barrel $60 Supply Curve $40 $20 Total Producer Surplus at a Price of $40 Quantity of Oil (MBD) 20 40 60 80
Important Supply Shifters Changes in Supply An increase in supply means that quantity supplied at a given price increases, or the minimum willingness to sell for a given quantity falls. Graphically, an increase in supply shifts the supply curve down and to the right. A decrease in supply means that quantity supplied at a given price decreases, or the minimum willingness to sell a given quantity rises. Graphically, a decrease in supply shifts the supply curve up and to the left. Changes in supply are inversely related to the costs of production.
Change in Supply Lower Costs Increase Supply Price of Oil per Barrel Old Supply Greater Quantity Supplied at the Same Price New Supply $50 $10 Willing to Sell Same Quantity at Lower Prices Quantity of Oil (MBD) 20 80
Change in Supply Higher Costs Decrease Supply Price of Oil per Barrel Smaller Quantity Supplied at the Same Price New Supply Old Supply $50 Higher Price Needed to Sell Same Quantity $10 Quantity of Oil (MBD) 20 80
Important Supply Shifters Important Supply Shifters Technological Innovations Input Prices Taxes and Subsidies Expectations Entry or Exit of Producers Changes in Opportunity Costs
Important Supply Shifters - Technological Innovations A technological innovation makes sellers willing to supply a greater quantity at a given price, or the new technology allows producers to sell a given quantity at a lower price. A technological innovation lowers costs and increases supply.
Important Supply Shifters - Input Prices A decrease (increase) in the price of an input makes sellers willing to supply a greater (lesser) quantity at a given price, or the lower (higher) input price allows producers to sell a given quantity at a lower (higher) price. A decrease (increase) in the price of an input lowers (raises) costs and increases (decreases) supply.
Important Supply Shifters - Taxes and Subsidies A tax on output makes sellers willing to supply a lesser quantity at a given price, or the tax forces producers to sell a given quantity at a higher price. A tax on output raises costs and decreases supply. A subsidy on production makes sellers willing to supply a greater quantity at a given price, or the subsidy allows producers to sell a given quantity at a lower price. A subsidy on production lowers costs and increases supply.
Important Supply Shifters - Taxes and Subsidies With a $10 Tax Suppliers Require a $10 Higher Price to Sell the Same Quantity Price of Oil per Barrel Supply With $10 Tax $50 Supply Without Tax $10 $10 $10 $40 60 Quantity of Oil (MBD)
Important Supply Shifters - Expectations The expectation of a higher (lower) price for a good in the future decreases (increases) current supply of the good. Sellers will adjust their current offerings in anticipation of the direction of future prices in order to obtain the highest possible price.
Important Supply Shifters - Expectations Expectations Can Shift the Supply Curve Price per Unit Supply Today with Expectation of Future Price Increase Supply Today Into Storage Quantity
Important Supply Shifters - Entry or Exit of Producers As producers enter and exit the market, the number of sellers of a particular good changes, directly influencing supply. Entry implies more sellers in the market increasing supply. Exit implies fewer sellers in the market decreasing supply.
Important Supply Shifters - Entry or Exit of Producers Entry Increases Supply Greater Quantity Supplied at the Same Price Price Domestic Supply Domestic Supply Plus Canadian Imports Lower Price for the Same Quantity Supplied Quantity
Important Supply Shifters - Changes in Opportunity Costs Inputs used in production have opportunity costs, and sellers will choose to employ those inputs in the production of the highest priced finished goods. Sellers will supply less (more) of a good if the price of an alternate good using the same inputs rises (falls).
Important Supply Shifters – Changes in Opportunity Costs Higher (Opportunity) Costs Reduce Supply Price per Unit Higher Price Required to Sell the Same Quantity Supply with High Opportunity Costs $7 Supply with Low Opportunity Costs $5 Smaller Quantity Supplied at the Same Price Quantity of Soybeans (Millions of Bushels) 2,800 2,000
What Shifts the Supply Curve? A change in quantity suppliedis NOT the same as a change in supply. Quantity supplied changes only when the price of a good changes. Graphically, a change in quantity supplied is represented by a movement along a fixed supply curve. Supply changes only when a non-price factor changes. Graphically, a change in supply is represented by a shift in the entire supply curve.
Technological innovations in chip making have driven down the costs of producing computers. What happens to the supply curve for computers? Why? • The U.S. government subsidizes making ethanol as a fuel made from corn. What effect does the subsidy have on the supply curve for ethanol?