Download
1 / 26
260 likes | 433 Views
Chapter 2: Demand & Supply. Supply: The Business Side. Supply. Supply is the relationship between the various possible prices of a product and the quantities of the product businesses are willing to supply. Quantity Supplied.

E N D
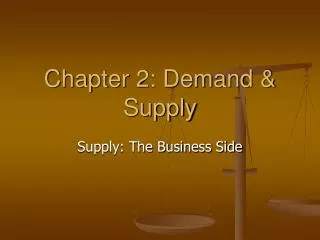
Chapter 2: Demand & Supply Supply: The Business Side
Supply Supply is the relationship between the various possible prices of a product and the quantities of the product businesses are willing to supply
Quantity Supplied • The amount of product businesses are willing to supply at each price
Law of Supply • There is a direct relationship between a product’s quantity supplied and its price • If price increases, quantity supplied increases (ceteris paribus) • If price decreases, quantity supplied decreases (ceteris paribus)
Market Supply The sum of all producers quantity supplied at each price
The Market Supply Curve for Strawberries P $ . S . $2.50 . $2.00 Price . $1.50 . $1.00 $0.50 0 Q 5 10 15 20 25 Quantity Supplied (000’s of baskets)
A change in supply is represented by a shift of the supply curve A change in quantity supplied (represented by a movement along a supply curve) is caused by a change in price In Supply vs. in Quantity Supplied
Changes In Supply • While price changes will cause quantity supplied to change, other factors can cause supply to increase or decrease
Supply Determinants • Number of Producers 2. Resource Prices 3. State of Technology 4. Changes in Weather 5. Prices of Related Goods
1. Number of Producers • Increase in # of producers causes an increase in supply (shifts supply curve to the right) • Decrease in # of producers causes an Decrease in supply (shifts supply curve to the left) • Direct relationship
2. Resource Prices • Businesses buy resources (factors of production) to produce goods and services • Increase in resource prices increase costs • An increase in resource prices causes supply to decrease (shift to the left) • An decrease in resource prices causes supply to increase (shift to the right) • Indirect relationship
3. State of Technology • Increased efficiency allows businesses to produce more goods and service at every price • Improvement in technology will increase supply (shift to the right)
4. Changes in Nature • Earthquakes, early frost, high temperatures, floods, etc. can affect the supply of many products • Poor weather conditions can decrease supply (shift to the left) • Like wise, a good season can increase the supply of products, such as fruit, vegetables, flowers, etc. (shift to the right)
5. Prices of Related Goods • Supply of a product can be influenced by changes in the prices of other products. • Ex: Decline in price of tobacco causes farmers to switch to ginseng (a rise in supply, shifting S out and right)
An Increase In the Supply of Strawberries • An increase in supply is represented by a shift in the supply curve to the right (S1). • At each price point, producers are willing to supply more goods. For example, at $1.00, producers were supplying 10,000 baskets. Now producers are willing to supply 15,000 (an increase of 5,000 baskets)
An Increase In the Supply of Strawberries P $ S S1 $2.50 $2.00 Price $1.50 $1.00 $0.50 0 Q 5 10 15 20 25 Quantity Supplied (000’s of baskets)
A Decrease in the Supply of Strawberries • A decrease in supply is represented by a shift to the left of the supply curve (S0) • At all prices, producers are willing to supply less strawberries • Example: At $1.50, producers were willing to supply 15,000 baskets. Given the decrease in supply, producers are now only willing to supply 10,000 baskets (a decrease in supply of 5,000 baskets)
A Decrease in the Supply of Strawberries P $ S0 S $2.50 $2.00 Price $1.50 $1.00 $0.50 0 Q 5 10 15 20 25 Quantity Supplied (000’s of baskets)
Supply Elasticity Also known as Price Elasticity of Supply • Measures producers response to the quantity supplied of a product to a change in price
Elastic Supply • More responsive to price changes • A given percentage change in a products price results in a larger percentage change in its quantity supplied.
Inelastic Supply • Less responsive to price changes • A given percentage change in price results in a smaller percentage change in quantity supplied.
Factors That Affect Supply Elasticity • The Immediate Run • The Short Run • The Long Run
The Immediate Run • Period where businesses in an industry can make no changes in the resources they use (labour, capital, natural) • In the immediate run, supply is perfectly inelastic • Fig. 2.15 p. 63
The Short Run • Period where at least one of the resources can be changed • Ex. Increasing labour • Supply curve can be elastic or inelastic • Depends on % change in P compared to % change in Qs
The Long Run • In the long run, all the resources used by a business can be changed. • Human, capital & natural resources can be altered • Supply is elastic