Download
1 / 23
230 likes | 409 Views
The optimal management of wetlands: quantifying tradeoffs between flood risks, recreation and biodiversity conservation. Ekin Birol 1 , Nick Hanley 2 , Phoebe Koundouri 3 , Yiannis Kountouris 3.

E N D
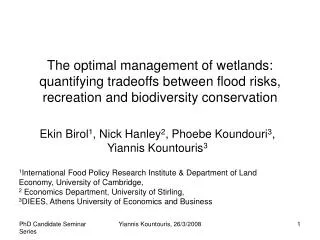
The optimal management of wetlands: quantifying tradeoffs between flood risks, recreation and biodiversity conservation Ekin Birol1, Nick Hanley2, Phoebe Koundouri3, Yiannis Kountouris3 1International Food Policy Research Institute & Department of Land Economy, University of Cambridge, 2 Economics Department, University of Stirling, 3DIEES, Athens University of Economics and Business Yiannis Kountouris, 26/3/2008
Examine the impacts of natural disasters threat (flood risk) on the valuation of an environmental good • Evaluate the importance of preference heterogeneity in the valuation of these goods • Wetland valuation: Birol and Cox (2007); Birol Karousakis and Koundouri(2006); Carlsson, Frykblom and Liljenstolpe (2003); Morrison, Bennett and Blamey (1999) • Biodiversity valuation: Nunes and van den Bergh (2001), Spash and Hanley (1995) • No unified valuation study of biodiversity that explicitly states the risk of flood damages Yiannis Kountouris, 26/3/2008
Why? • Wetlands provide many ecological services that translate to economic values • Biodiversity Habitat, Recreational Activities, Carbon Sequestration, Nutrient retention • Flood risk is an important natural hazard concern in Central Europe • Flood control measures often imply the sacrifice of wetland habitats • Is this efficient? • Are there economic values generated from wetland habitats in the presence of natural disaster threats? • Which of flood control, biodiversity and recreation creates the greatest value? • Are preferences homogeneous across individuals? Yiannis Kountouris, 26/3/2008
The Choice Experiment Method (CEM) • Non-Market Valuation to circumvent the absence of markets and market prices • Creates a hypothetical market in which individuals are called to participate • Stated Preference Method • Survey based data collection • Survey Design: • The good to be valued is defined in terms of its constituent attributes and their levels • If one of the attributes is monetary, then the marginal WTP for each attribute can be extracted • Profiles are constructed from the attributes and their levels • Respondents are called to make a series of choices between different profiles and an opt-out alternative Yiannis Kountouris, 26/3/2008
The Choice Experiment Method – Survey Design • Define the good to be valued in terms of a finite number of attributes and levels • Formulate the valuation scenario in a credible manner • Design the choice experiment • Define the data collection method • Define the sample • Formulate the questionnaire • Test the questionnaire • Implement the questionnaire Yiannis Kountouris, 26/3/2008
The Choice Experiment Method (CEM) • Lancaster’s (1966) characteristics theory of value • Demand is defined over the characteristics/attributes defining a good and not on the good itself • Random utility theory • How individuals make choices over discrete alternatives • Conditional Logit Model: Does not allow for preference heterogeneity across respondents • Mixed Logit Models, Covariance Heterogeneity Models • Preference Heterogeneity at the individual’s level Yiannis Kountouris, 26/3/2008
Latent Class Model (LCM) • Morey, Thacher, Breffle (2006); Boxall and Adamowicz, (2002) • Preference heterogeneity is accounted for by a discrete distribution over endogenous (latent) classes/segments of respondents • Preferences are assumed to be homogeneous within segments but are allowed to differ across segments • The population is broken down in a finite number of segments simultaneously with the model estimation Yiannis Kountouris, 26/3/2008
Latent Class Model (LCM) • The utility of respondent i belonging to segment s from option j is given by: • Where is the systematic component of utility: X the matrix of attributes and the segment specific parameter vector. is the random component of utility • The Probability option j is selected by respondent i belonging to segment s is given by: • Membership to a segment is determined by a likelihood function: Where Z is the individual specific matrix of socioeconomic characteristics and is the error term Yiannis Kountouris, 26/3/2008
Latent Class Model (LCM) • The probability that a respondent i belongs to segment s is given by: • The joint probability that a respondent belonging in segment s will choose alternative j is given by: Yiannis Kountouris, 26/3/2008
The Case Study • Brobrek Area, Upper Silesia Region, Poland • Externalities from coal mines • Large Damages from past flooding ($1 billion in 2001) • 50,000 individuals directly threatened form floods • Failed policies for flood control • New habitats formed, with significant biodiversity • High recreational value of river banks Yiannis Kountouris, 26/3/2008
Survey design – Defining the problem and the survey • Consultations with local ecologists, hydrologists and engineers • Focus groups with the general public • Initial survey tests • Formulation of the final survey Yiannis Kountouris, 26/3/2008
Survey- the experimental design • The attributes and the levels used in the experimental design: • Using an othogonalization procedure we end up with 32 pair wise choice sets • The choice sets are randomly blocked to 4 versions, each administered to ¼ of the sample • Each respondent is called to make 8 choices among 2 river management plans and an opt-out alternative Yiannis Kountouris, 26/3/2008
Survey – Attributes’ Levels definitions • Flood risk: HIGH: This is the case where no measures are taken and it also reflects the current flood risk level. Danger of flooding is imminent in case of rainfall. No barriers of any kind will be formed in order to protect from flooding. Currently, the flooding risk is high. LOW: Both underground and surface barriers are set in place. The material is proposed to be wood for the surface barriers and concrete for the underground ones, so that the area will maintain its aesthetic value. • River Accessibility:EASY: Canalization of the river is very similar to the natural one. Materials such as concrete will not be used. Access to the river’s water will be possible and easy for everyone. DIFFICULT: Rivers will be canalized by forming vertical walls, the same measure that has been used in the past • Biodiversity: LOW: If the current situation prevails, the number of different species of plants and animals, their population as well as the number of different habitats and their size will reach a minimum level. HIGH: As a result of reclamation activities on the existing spoil heaps especially afforestation in the wetlands, the number of different species of plants and animals; their population levels and the number of different habitats and their size will reach a higher level within the next 10 years. This will have a positive effect on the entire area, as its aesthetic and economic value will increase. • Local Tax: The levels are as follows, 10% less than the present level, 5% less than the present level, 5% more than the present level, and 10% more than the present level. If no action is taken then your local tax will remain as it is today. Yiannis Kountouris, 26/3/2008
An example of a choice set Yiannis Kountouris, 26/3/2008
Data collected and data collection • Questions to derive indices on environmental behavior and environmental consciousness • Socioeconomic data (age, education, employment, household income, car ownership, house ownership, number of children etc) • In-person interviews by trained personnel • 200 households interviewed • 8 protestors identified and removed from the sample • Final dataset contains the responses from 192 individuals for a total of 1536 observations. Yiannis Kountouris, 26/3/2008
Results-Sample Statistics Yiannis Kountouris, 26/3/2008
Number of segments selection • Log Likelihood decreases and ρ2increases as segments are added: indicates • multiple segments • AIC3 and BIC decrease as segments increase • BIC is minimized at 3 segments and for all statistics the effects become noticeably • smaller after the 3-segment model. • The 3 segment model produces an empty segment. • Then the optimal number of segments is 2 Yiannis Kountouris, 26/3/2008
Results-Latent Class Model • All management attributes are significant determinants of choice • 1st segment: more likely to choose alternatives with: • Lower flood risk, lower biodiversity, easier access • 2nd segment: more likely to choose alternatives with: • Lower flood risk, higher biodiversity, easier access • Relative to 2nd segment those respondents in the 1st segment are: • Less likely to have been flooded over the last decade, • Less likely to use the wetland for recreational purposes, • Less likely to have a university degree • Less likely to have a child living in the household Yiannis Kountouris, 26/3/2008
Results-Segment Characterization • 1st segment respondents: • Pay less tax, have less income, live in smaller households • Are less likely to have been flooded university degree, own a house or a car Yiannis Kountouris, 26/3/2008
Results-Willingness to Pay (WTP) by segment To calculate the marginal WTP for decreased flood risk, improving biodiversity and easier river access: • WTP values are significantly different across segments • WTP is for all attributes is higher for respondents in the 2nd segment • Respondents in the 1st segment have negative WTP for biodiversity, i.e. they want • compensation to accept biodiversity improvement Yiannis Kountouris, 26/3/2008
Welfare measure - Compensating Surplus Scenario 0: High flood risk, low biodiversity, difficult recreational access Scenario 1: Low flood risk, low biodiversity, easy recreational access Scenario 2: High flood risk, high biodiversity, easy recreational access Scenario 3: Low flood risk, high biodiversity, easy recreational access Where, CS is the compensating surplus, Vi0 Vi1 and is the indirect utility before and after the policy change Yiannis Kountouris, 26/3/2008
Welfare measure- Compensating Surplus • Greater welfare gain from scenarios that reduce flood risk • Significant welfare improvements from the other scenarios • Compromise between flood risk reduction Yiannis Kountouris, 26/3/2008
Implications • Significant welfare gains from establishing river management strategies • Largest benefits from flood control • Significant Preference Heterogeneity • Different magnitude and sign of the attributes impact on individual choice • There appears to be a tradeoff between flood risk reduction and biodiversity increase at least for the 1st segment of the population • Policy measures should be designed accordingly to achieve efficiency and equity • Cost Benefit Analysis to evaluate costs against the estimated benefits • Results can be transferred to similar situations • Benefits Transfer Yiannis Kountouris, 26/3/2008