
Exploring Topography through Maps: Understanding Elevation, Relief, and Landforms
E N D
Presentation Transcript
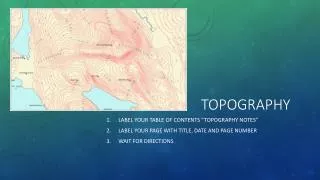
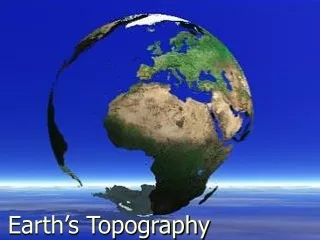
Topography Topography
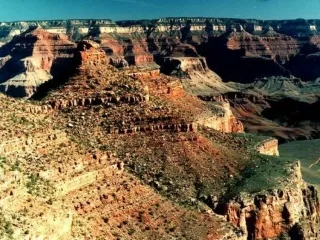
Topography The Shape of the land
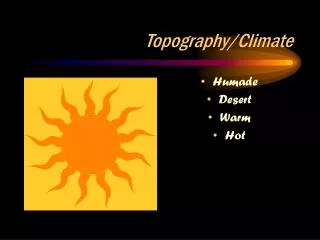
height above sea level difference in elevation (highest point and lowest point) Lowrelief Topography of an area is determined by: • Elevation: • Relief: High relief
Landform Topography shows us: a feature of topography Landforms, elevation and relief of each area.
Pair /Share What is elevation? Describe this diagram in terms of elevation. Elevation( ft)
Pair Share What is relief? Explain the relief in the picture.
Pair /Share What is Landform? Explain three different landforms in the picture:
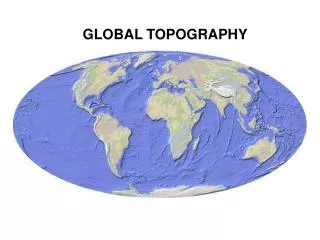
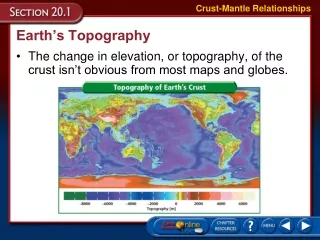
So if topography is the land features on the Earth’s surface (top)…then, what is a topographic map?
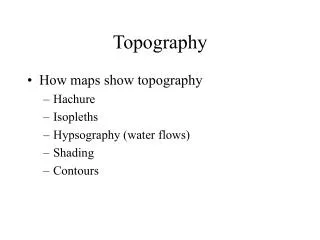
What is a topographic map? Topographic maps provide information about: Maps that show the surface features of an area. The shape of the land. Elevation Relief Slope
So if the map is flat then how can we see elevation, relief, and slope? Contour Lines: lines on the map that connect points of equal elevation
Contour interval: change in elevation from one line to the next…imagine each line like a step up or down
Contour lines Relationship between topographic features and contour lines
Now we’re at 200m. 200m 100m
Shall we march on? 200m 100m
We’ve made it to 300m! 300m 200m 100m
On to the peak! 300m 200m 100m
We’re on the peak, but what’s our elevation? 300m 200m 100m
Any ideas? Let’s add contour lines for every 50 meters and see if that helps. 300m 200m 100m
We know that we are above 350m, but less than 400m. 350m 300m 250m 200m 150m 100m 50m
Let’s now look at the same hill, but the way we might see it from an airplane!
Features of Topographic Maps Relationship between 3D and 2D representation 3D view 2D view
Pair Share: What does it mean if the contour lines are close together?
Pair Share: What does it mean if the contour lines are far apart?
Notice how the contour lines are used to show how gentle or steep the slope is.
Why would it be important to know if something was steep or gentle slope?
Sometimes on maps you will see dark colored lines? • Why do you think they have dark colored contour lines on the map?
IndexContours • is a contour line that is thicker or darker. • occur every fifth contour line.
Hills • Represented by a series of contour lines in a rough circle
Streams • looks like an upside down V. • It opens in the direction the water is flowing.
Depressions • Show indents. • Drawn with marks on the inside.
Pair Share • What are index contours and how are they shown on the map? • Why are index contours important? • If you were to create a topographical map what would it look like if you were to try and show a hill? • If you were to create a topographical map what would it look like if you were to try and show a depression or stream?
Topographic maps also identify natural structures and structures made by man.
1. Name the highest elevation shown for this volcano. 2. What is the contour interval of this map? 1250 1000 1000 1500 2500 2250 2000 1750 1500 1000 1250 1000
3. What is the elevation of Point B? Point B sits right on the 10 ft contour line. Since all points on this line have an elevation of 10 ft, the elevation of point B is 10 ft.
4. What is the elevation of Point C? Point C does not sit directly on a contour line so we can not determine the elevation precisely. We do know that point C is between the 10ft and 20 ft contour lines so its elevation must be greater than 10 ft and less than 20 ft. Because point C is midway between these contour lines we can estimate the elevation is about 15 feet (Note this assumes that the slope is constant between the two contour lines, this may not be the case).
5. What is the elevation of Point D? We are even less sure of the elevation of point D than point C. Point D is inside the 20 ft. contour line indicating its elevation is above 20 ft. Its elevation has to be less than 30 ft. because there is no 30 ft. contour line shown. But how much less? There is no way to tell. The elevation could be 21 ft, or it could be 29 ft. There is now way to tell from the map.
6. What is the elevation of Point E? Just as with point C above, we need to estimate the elevation of point E somewhere between the 0 ft and 10 ft contour lines it lies in between. Because this point is closer to the 10 ft line than the 0 ft. line we estimate an elevation closer to 10. In this case 8 ft. seems reasonable. Again this estimation makes the assumption of a constant slope between these two contour lines.
Review Questions • How are contour lines drawn on maps? • How does a contour map show whether a slope is gentle or steep? • Describe at least four natural or man-made structures that can be shown on a topographic map
How’s It Used? Can you think of some ways a topographic map might be used? Topographic Maps are used in: • Geographic Planning • Architecture • Civil Engineering • Earth Sciences • Mining • Hiking
Warm-up #5 Write if each example of chemical or mechanical weathering. • Halite in rocks is dissolving. • Acid from plant roots break up the rock. • Wind blows sand around cutting at the side of a mountain. • Carbonic Acid dissolves limestone creating a stalagmite in a cave • A rock turns red due to oxidation • A rock becomes smaller as it travels down stream.
Warm-Up # 1 • What is a contour line? • A line that connects points of equal elevation. • What are 4 major agents of erosion? • Water, wind, ice and gravity • What is the dominant agent of weathering and erosion. • Water
Warm-Up # 8 1. What is a contour line? 2. The change in one elevation to the next is called? • A ____ map shows the surface features of an area. • Explain how weathering, erosion and deposition change the topography of the land? • What are the 4 agents of erosion?
Warm-Up # 7 1. What is a contour line? 2. Describe the difference between a high relief and a low relief. • Draw how the following landforms would look on a topo map: • Depression • Hill 4. What causes iron to rust? 5. What type of weathering is it when water dissolves a rock?
Warm-Up # 3 1. What is a contour line? 2. Describe the difference between a high relief and a low relief. • Draw a: • Depression • Hill
Warm Up #8 What is the elevation at A:, B:, C:, D: E:?