Download
1 / 27
270 likes | 314 Views
Discover the intricacies of topography through maps showing natural features like elevation, buildings, water bodies, and railways. Learn about contour intervals, benchmark points, depression contours, and slope calculations.

E N D
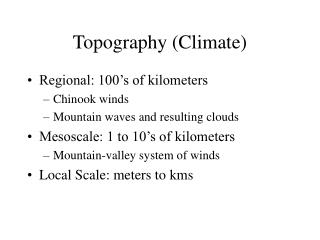
Topography 1) the arrangement of the natural and artificial physical features of an area. 2)a detailed representation on a map of the natural and artificial features of an area. Includes: elevation, buildings, water, railroads, etc
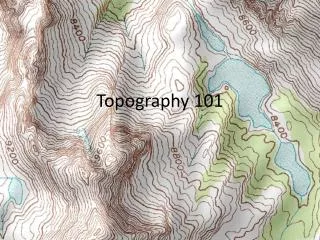
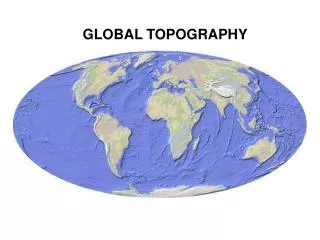
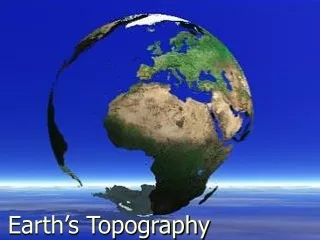
Topographic Maps: specialized maps which show the highs and lows (relief) of the Earth’s surface Topographic Maps
Definitions: • Field : A region in which similar quantities can be measured at every point or location (ex. temperature in a room) • Isolines: Connect points of equal values on a map • Contour line: Connect points of equal elevation
Index contour: A contour line that has elevation noted on it. Typically a multiple of five or ten • Contour interval: The difference in the height between two contour lines that are next to each other. NOTE: A contour interval shows a difference in vertical height and a map scale shows horizontal distance :
Determining the Contour Interval: Contour interval = (Index Contour 2-Index Contour 1)/ Number of Lines between Ex.: (300-200)/5= ________= ______________
Parts of a Topo Map • Benchmarka point where the actual elevation is known. • Elevation is shown on the map by the letters BM or the letter “X” and the elevation next to it. (ex. BM 1078 or X1078) • This symbol may also be used:
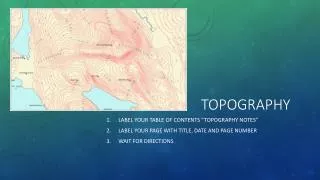
GIANT MTN, CASCADE MTN WINDHAM HIGH PEAK
Depression contours: shows where the elevation decreases (a hole, volcano crater, etc.) • When reading the depression contour, the elevation of the first one is the same elevation as the regular contour before it. The next depression contour decreases the same amount as the contour interval
DRAWING AND LABELING DEPRESSION CONTOURS- will do in class: Depression contours are shown with dashed lines inside of the contour line circles
Contour lines Index contour benchmark
What Happens When a Contour Line Crosses A Stream? 1. When lines cross a stream, they bend making a “V” 2. The “V” points upstream, opposite the direction of flow. EXAMPLE (will do in class):
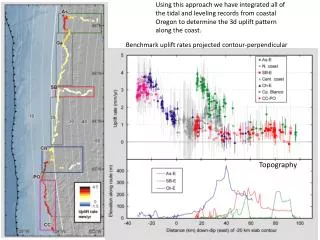
Slope • Escarpments: Another word for cliff • But how steep is it??? • Recall that gradient or slope can be determined by….. • (Ending Elevation—Starting Elevation) _____________________________ Change in Distance
Some Important Points • Contour lines are circles within circles • Contour lines never cross each other, but they may touch • Contour lines are darker every 5th line and this darkened line will have the elevation printed • Contour lines are not spaced evenly. • The closer the lines, the steeper the slope • The smaller the circle, the closer you are to the top of a hill
Profile: side view of the hill/mountain; drawn by using a contour map and by plotting the elevations of certain points on a vertical axis
Video and Directions • Watch the following video- jot down three notes about the video to get full credit https://www.youtube.com/watch?v=K-UXrpAjyl0 Can’t load using the link? Search for “Monkey See Topography” • Review the following slides, but do not take notes… I will make copies for you when we do this in class!
Making a Profile from a Topographic Map • Lay a piece of scrap paper along the line where the profile is to be constructed. • Make a mark on the scrap paper at the exact place where each contour line, stream and hill top crosses the profile line. • Label each mark with the elevation of the contour it represents.
d. On the graph provided, label the horizontal lines with matching elevations, if not already completed for you e. Place the scrap paper with the labeled contour lines at the bottom of the graph and project each contour to the horizontal line of the same elevation. Make a dot at this location f. Connect the dots. g. Round out hills and valleys- do not draw lines straight across
Place a paper strip over the line you want to draw a profile of. Mark clearly each line of contour of your line. Below these marks, write down the elevation of each line of contour.
Place your paper onto a graph. Copy each point. Connect the dots! EASY!