Download

1 / 28
280 likes | 299 Views
Explore the Uniform Crime Report and National Crime Victimization Survey, their strengths and limitations, and the impact of statistical manipulation on crime statistics. Understand the patterns revealed by these sources and their implications on policing accuracy and societal health. Learn about the National Incident-Based Reporting System and the challenges in accurately measuring crime. Discover how different factors influence the reliability of crime data and the complexities of data collection in the criminal justice system.

E N D
Chapter 2The Incidence of Crime Lee Ayers-Schlosser, Southern Oregon University
Define the elements of the Uniform Crime Report (UCR) and identify its strengths and weaknesses as a crime data source. Define the elements of the National Crime Victimization Survey (NCVS) and identify its strengths and weaknesses as a crime data source. Chapter Objectives (1 of 2)
Define the elements of the National Incident-Based Reporting System. Understand what patterns are present in the UCR and the NCVS and what they tell about crime. Summarize what data sources tell about the criminal justice system. Chapter Objectives (2 of 2)
You Are the Criminologist Lying with Statistics—Police Style • Crime statistics are used to assess quality of police performance. • Temptations arise to manipulate statistics to demonstrate positive performance. • New Orleans (2002–2003) downgraded the level of certain offenses. • How would such manipulation influence the accuracy of city wide statistics?
Introduction (1 of 2) • Crime is difficult to measure. • Crime statistics are viewed as an indicator of societal health. • It is important to have accurate statistics for operational purposes.
Introduction (2 of 2) • High crime leads to alarm • Low crime leads to feelings of security • Problems in data collection • Not all crimes are reported. • Some crimes are “invisible.” • Most crime is not observable.
Sources of Crime Statistics (1 of 2) • Uniformed Crime Report (UCR)—lists crimes reported to the police • National Crime Victimization Survey (NCVS)—documents the extent of victimization • Most crimes not directly observable
Sources of Crime Statistics (2 of 2) • 1929 International Associations of Chiefs of Police developed a uniform crime reporting program. • 1930 FBI began to compile nationwide crime statistics.
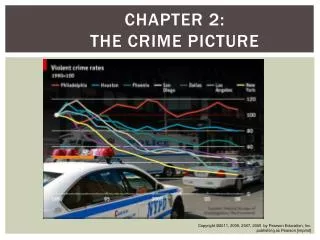
The Uniform Crime Report (1 of 2) • Major source of crime statistics • Annual report: Crime in the United States • Standardized definitions of crime • Only most serious offenses (index offenses) • Crime index indicates the level of serious crime in the United States • Information from most jurisdictions • Makes it possible to analyze and compare crime rates across regions
The Uniform Crime Report (2 of 2) • Limitations • UCR figures reflect only the volume of crime reported to the police. • UCR figures are affected by the recording practices of the police. • UCR emphasizes street crime. • Crimes reported to the police mainly reflect the results of their style of work.
The National Incident-Based Reporting System • URC changed system of data collection in 1991 to generate more information to conduct crime analysis. • Will eventually replace the UCR.
National Crime Victimization Survey (1 of 2) • Conducted by the Bureau of Justice Statistics • Purpose: to uncover crime that has not been reported • Scientifically designed annual survey • Representative sample of 60,000 households
National Crime Victimization Survey (2 of 2) • Improvement over UCR • Information taken directly from victims • Collects background information on victims • Uncovers more crime than reported in UCR • High level of correlation with UCR
NCVS gives specific information about crime by focusing on victims’ attributes: Gender Race Age Household income Marital status Region Residence Victim–offender relationship Weapons in violent crimes Attributes of Victimization Patterns, 2003
Categories of Victims and Victimization (1 of 4) • Intimate partner violence, 1993–2001 • Significant category of crime victimization • Recent domestic violence laws and programs have increased public awareness and led to a decline in victimization.
Categories of Victims and Victimization (2 of 4) • Violent victimization of college students, 1995–2000 • Most victims not injured • Risk increased by nighttime partying and drug use • Prevention by disassociation with dangerous people and activities
Categories of Victims and Victimization (3 of 4) • School crime and safety • Age • Use of a weapon • Fighting • Bullying • Victimization rates are declining
Categories of Victims and Victimization (4 of 4) • Violence in the workplace, 1993–1999 • Incidence • Race • Gender • Victim–offender relationship • Weapons
Limitations of the NCVS • Respondents are not always reliable. • Respondents may not be truthful. • NCVS asks questions about rape in an indirect fashion. • There are problems administering the survey or coding the data. • The survey does not contain specific information on particular areas.
Criminal Justice System Statistics • Another crime indicator is the size of the population being served by different parts of the criminal justice system. • Results are not always a clear indicator of the nature of crime, but rather what type of enforcement has been a priority. • Criminal justice statistics reflect who is in the system, not necessarily what is going on in society regarding a particular type of offense.
Jail Population (1 of 2) • Annual survey • Jails are local facilities with inmates: • With short-term sentences (< 1 year) • Pending arraignment • Awaiting trial or sentencing • From overcrowded facilities • Jail population figures help determine how to manage jail space and avoid overcrowding.
Jail Population (2 of 2) • Trends • Jail population size • Gender • Race • Jail space
Prison Population • Federal and state adult correctional institutions • Trends • Prison population size • Gender • State vs. federal prisons • Age • Race • Gender
Probation and Parole Figures (1 of 2) • Probation is an alternative sentence instead of incarceration. • Parole is a form of early conditional release from incarceration.
Probation and Parole Figures (2 of 2) • Trends • Size of probation population • Type of offense • Race • Gender • Recidivism rates
Conclusion • Actual volume of crime is difficult to estimate. • Not all crimes are reported or uncovered. • Figures collected by criminal justice agencies are more accurate reflections of their own operation than of the true crime rate.