Chapter 2: The Crime Picture
610 likes | 1.02k Views
Chapter 2: The Crime Picture. FIGURE 2–1 The criminal justice funnel. Source: Derived from Tracey Kyckelhahn and Thomas H. Cohen, Felony Defendants in Large Urban Counties, 2004 (Washington, DC: Bureau of Justice Statistics, 2008). The Collection of Crime Data. The Value of Data.

Chapter 2: The Crime Picture
E N D
Presentation Transcript
FIGURE 2–1 The criminal justice funnel. Source: Derived from Tracey Kyckelhahn and Thomas H. Cohen, Felony Defendants in Large Urban Counties, 2004 (Washington, DC: Bureau of Justice Statistics, 2008). The Collection of Crime Data
The Value of Data • Data are valuable and can be used to • Shape public policy • Analyze and evaluate existing programs • Create new programs • Plan new laws • Develop funding requests • Local Results • http://www.goccp.maryland.gov/msac/documents/FactSheets/Calvert.pdf
Sources of Data • Nationally, crime statistics come from two major sources: • Uniform Crime Reports (aka the UCR/NIBRS Program) • National Crime Victimization Survey (NCVS) • Additionally, data are available from: • Professional organizations (example: PERF) • Offender self-reports • Other regular publications (example: Sourcebook of Criminal Justice Statistics)
The NIBRS is a separate report. It’s the old version of the UCR system
Uniform Crime Reports • The reports began in 1930. • Data are collected by F.B.I. • Approximately 16,000 police agencies provide data. • Only crimes known to the police are included. • Law enforcement agencies submit reports voluntarily. • Until 2006, the UCR presented data in a Crime Index.
UCR: Crime Index • The Index is made up of Part I Offenses (excluding arson). • Part I Offenses • Violent Crime • murder, rape, robbery, assault • Property Crime • burglary, larceny, motor vehicle theft, arson
PROSTITUTIONBURGLARY LARCENY ASSAULTARSONRAPE DUI CROSS OUT THE ITEMS THAT ARE NOT PART 1 UCR OFFENSES
NIBRS: The New UCR • National Incident Based Reporting System • Incident driven, rather than summary based • FBI started this program in 1988. • City, county, state, and federal law enforcement agencies furnish detailed data on crime and arrest activities at the incident level. • The NIBRS isn’t a separate report; it’s the new methodology underlying the modern-day UCR system
NIBRS IS….. New Informative Burglary Reporting System National Incident Based Reporting System National Information Based Reporting System
NIBRS • The new UCR/NIBRS is much more detailed than the old UCR system, including data on: • place of occurrence • weapon used • type and value of property damaged or stolen • the personal characteristics of the victim and offender • nature of victim-offender relationship • case disposition • It also replaced the old Part I and Part II offenses with 22 general offenses
UCR/NIBRS • Burglary • Counterfeiting • Vandalism • Gambling • Homicide • Fraud • weapons violations • Robbery • forcible sex offenses • non-forcible sex offenses • receiving stolen property 22 offenses include: • kidnapping • larceny • motor vehicle theft • pornography • prostitution • narcotics offenses • embezzlement • extortion • arson • assault • bribery
UCR/NIBRS Also collects data on: • bad checks • vagrancy • disorderly conduct • driving under the influence • drunkenness • non-violent family offenses • liquor law violations • “peeping Tom”activities • runaways • trespassing • general category of all “other” criminal law violations
UCR/NIBRS: Crime Rates • Most UCR/NCVS information is reported as a rate of crime. • CrimeRate= number of crimes/100,000 population • Rates allow for comparison across areas and times.
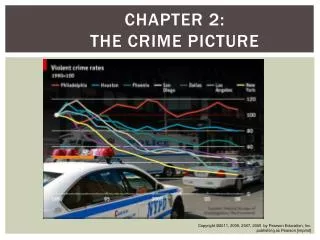
Major Shifts in Crime Rates • Since the FBI’s Uniform Crime Reporting Program began, there have been three major shifts in crime rates—and we may now be at the start of the fourth.
Major Shifts in Crime Rates • Early 1940s—Sharp drop in crime rate as many young men went to WWII. • 1960s-early 1990s—Dramatic increase in crime rates as police professionalism and victim reporting grew. • 1991-2006—Significant decline in most major crime rates as funding for crime fighting increase and many embrace a “get tough” attitude. • 2006-on—Violent crime rates starting to rise again pushed by economic uncertainty, more teens, copycat crimes, and social disorganization.
Draw a Line to Match Shifts in Crime Rates Draw a line to match the era with the crime trend 1940s 1960s-1990 1991-2006 2006- on. Sharp drop in crime rate as many young men went to WWII. decline in most major crime rates as many embrace a “get tough” attitude. Violent crime rates starting to rise again pushed by economic uncertainty increase in crime rates as police professionalism and victim reporting grew
The Transition • Reports of crime data available through the UCR/NIBRS program are now going through a transitional phase, • the FBI integrating more NIBRS-based data into its official summaries.
number of crimes “CLEARED” • number of crimes committed ClearanceRate= UCR/NIBRS: Clearance Rates • Clearances are based on arrests • Not judicial dispositions.
Clearance Rate = ?? # of crimes committed # of arrests # of crimes cleared # of crimes committed # of arrests # of crimes committed
Murder • …the unlawful killing of a human being by another. Includes: • All willful and unlawful homicides • Non negligent manslaughter Excludes: • Suicides • Deaths caused by accidents or negligence • Attempted murders
Data on Murder • Least likely Part I offense to occur • High clearance rate • Murders are more common during warmer months and in southern states • Most victims and perpetrators are age 20–24 • Weapon most often used: firearms • Victim and offender are often “acquaintances”
Murder: Multiple Killings • Spree—two or more people, killed on more than one occasion. • Mass—three or more people, killed in a single event. • Serial—several victims killed in three or more separate events and over time.
Serial Murder is…… several victims killed in three or more separate events and over time. two or more people, killed on more than one occasion. three or more people, killed in a single event
Forcible Rape …the carnal knowledge of a female forcibly and against her will. - Includes: • Assault or attempt to commit rape by force or threat of force - Excludes: • Assault if victim is male • Statutory rape (without force) • Same-sex rapes • Other sex offenses
Forcible Rape: One of the most underreported violent crimes • Many victims do NOT report because they: • Think the police won’t be able to catch the suspect. • Believe that the police will be unsympathetic. • Want to avoid the embarrassment of publicity. • Fear reprisal by the rapist. • Fear additional “victimization” by court proceedings. • Want to keep family/friends from knowing.
Forcible Rape • Most rapes are committed by acquaintances of victim, as in the case of date rape. • Most rapists appear to be motivated by the need to feel powerful. • Use of the “date rape drug” Rohypnol is rising.
Robbery • …the unlawful taking or attempted taking of property that is in the immediate possession of another by force or violence and/or by putting the victim in fear. • Excludes: • Pick pocketing • Purse snatching • http://www.baltimoresun.com/news/maryland/howard/laurel/ph-laurel-armed-robbery-20130516,0,2302971.story
Aggravated Assault • …unlawful inflicting of serious injury upon the person of another. • Includes: • Attempted assaults, especially when a deadly weapon is used • The possible use of a gun, knife, or other weapon that could result in serious injury • Excludes: • Simple assaults
Burglary • …unlawful entry of a structure to commit a felony or theft. • Types of burglaries: • Forcible entry • Unlawful entry without force • Attempted forcible entry
Larceny–theft • …unlawful taking or attempted taking, carrying, leading, or riding away of property from the possession of another. • Motor vehicles thefts are excluded. • Includes (in declining order of frequency): • Theft from motor vehicles • Shoplifting • Theft from buildings • Theft of motor vehicle parts and accessories • Bicycle thefts • Theft from coin-operated machines • Purse snatching • Pocket picking • Is the most frequently reported crime (yet still greatly underreported). • http://www.youtube.com/watch?feature=player_detailpage&v=zraLOHAjpUc Mute sound – Inappropriate Lyrics
Motor Vehicle Theft • …the theft or attempted theft of a motor vehicle. • A “motor vehicle” is a self-propelled vehicle that runs on land and not on rails.
Motor Vehicle Theft • Excludes • trains • airplanes • bulldozers • most farm equipment • ships • boats • spacecraft • Includes • automobiles • motorcycles • motor scooters • trucks • buses • snowmobiles
Motor Vehicle Theft • Carjacking...the taking of a motor vehicle directly from the owner by force • Legally, carjacking is a type of robbery, not a motor vehicle theft. • It accounts for just over 1% of all car thefts.
Arson • …the burning or attempted burning of property, with or without the intent to defraud. • …does not include fires of unknown or suspicious origins • …became a Part I offense in 1979 • Most common type of is burning of structures, followed by burning of vehicles • Low clearance rate—18.7% • Average loss per offense—$17,289
Robbery is…… the most frequently reported crime (yet still greatly underreported). unlawful entry of a structure to commit a felony or theft the unlawful taking/attempted taking of property of another by force or violence threat thereof
Part II Offenses • Part II offenses are less serious than Part I • Offenses and include many social order • Offenses, such as: • Simple assault • Driving under the influence • Prostitution • Vandalism • Receiving stolen property • Fraud • Embezzlement
NCVS • National Crime Victimization Survey • Began operation in 1972 • Based on victim self-reports • Designed to measure the “dark figure” of crime • Uses data collected by the Bureau of Justice Statistics • More than 43,000 households are surveyed twice per year • Measures “households” touched by crimes
NCVS • Includes data on: • Rape • Robbery • Assault • Burglary • Personal and household larceny • Motor vehicle theft
NCVS Statistics Reveal • About 1/2 of all violent crime is reported. • Slightly more than 1/3of all property crime is reported. • Victims are more likely: • Men • Younger people • African American • City residents • Lower income (for violent victimization) • Household crime rates are highest for households: • Headed by African-Americans • Headed by younger people • With six or more members • Headed by renters • Located in central cities
NCVS IS….. NEW CRIME VIOLENCE SURVEY NATIONAL CRIMINAL VIOLENCE SURVEY NATIONAL CRIME VICTIMIZATION SURVEY
Problems with the UCR/NIBRS &the NCVS • NCVS • There is potential for false or exaggerated reports • False reports may be generated by overzealous interviewers • Some people won’t respond • Respondents may suffer from faulty memories • Respondents may misinterpret events • Hierarchical counting system • Contains only data that BJS thinks is appropriate • UCR/NIBRS • Not everyone reports • Some crimes are rarely reported • Victims inaccuracies • Bureaucratic influences • Hierarchical counting system • Contains only data that FBI thinks is appropriate
A problem with UCR/NIBRS Reporting is the potential for false or exaggerated reports
Crime Typology • A classification of crimes along a particular dimension • legal categories • offender motivation • victim behavior • characteristics of individual offenders • Situations of criminal event
Special Categories of Crime • Crime against women • Crime against the elderly • Hate crime • Corporate and white-collar crime • Organized crime • Gun crime • Drug crime • High-technology and computer crime • Terrorism
Women and Crime • Compared to men, women are: • Less likely to be victimized in every major personal crime other than rape. • More likely than men to be injured as a result of crime. • More likely to make lifestyle modifications because of threat of crime.
Findings of the National Violence Against Women Survey (NVAWS) • 52% of women surveyed have been physically assaulted as a child or as an adult. • Approximately 1.9 million women are physically assaulted in the U.S. each year. • 25% of women, compared to 8% of men surveyed, said they had experienced partner violence. • 18% of women have experienced a completed or attempted rape; more than half of these were under 18 when first raped. • Women are significantly more likely to be injured during an assault. • Violence against women is primarily partner violence. • 8% of women have been stalked
Violence Against Women Act (VAWA) • Seeks to eliminate violence against women. • Act extends the Rape Shield Law to civil cases and to all criminal cases. • Provided federal funding to: • Educate police, prosecutors, and judges about special needs of female victims. • Provide specialized services for female victims of crime. • Fund battered women's shelters. • Support rape education.
Anti-Stalking Laws • All states have anti-stalking laws, which give additional protection to women. • 80% of stalking victims are women. • Cyberstalkinginvolves using the internet, email, or other electronic communication technologies to stalk another person.
Elderly Crime Victims • The elderly generally experience the lowest rate of victimization—both violent and property—of any age group. • Elderly victims are more likely than younger victims to: • Be victims of property crime than of violent crime. • Face offenders who are armed with guns. • Be victimized by strangers. • Be victimized in or near their homes during daylight hours. • Report their victimization to the police. • Be physically injured. • Be less likely to try to protect themselves during victimization.