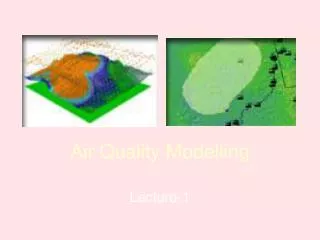
Air Quality Modelling
Identify problem. Pollutant. Sources. Interventions 1 ........ 2 ........ 3 . Reduced emissions. Reduced impacts. Cost effective priority. COST. COST. Air Quality Modelling. Workshop presented in Qatar. Day 4. Air Quality and Health Scenarios and Policy Actions.

Air Quality Modelling
E N D
Presentation Transcript
Identify problem Pollutant Sources Interventions 1 ........ 2 ........ 3 ......... Reduced emissions Reduced impacts Cost effective priority COST COST Air Quality Modelling Workshoppresented in Qatar Day 4 Air Quality and HealthScenarios and Policy Actions
Scenarios and impact assessment • Scenario development • Types ofimpacts • The conceptofexposure • Health impactassessment • Relative contributions • Dose responses • Costeffective analyses • Action plans
Health effectsof air pollution • Health effectsdependon: • Local air pollution: composition and concentrations • Timing and durationofexposure • Localpopulation: geneticmake-up, gender, age • Lifestyle: exposure - related, other (activitylevel, occupation)
SCOPE OF THE AIR PROBLEM • WHO: Worldwide, outdoor air pollution contributes to: • ~ 800 000 deaths per year • ~ 4.6 million healthy life-years lost per year • Uneven burden • 65% deaths and lost life-years occur in Asia • The basis for assessments is based on European and North American research and surveys: • Need for regionally-developed research and info
Example: healthendpoints Source: WHO
Health effects and healthimpacts Health effects (individual, population) - examples Health impacts (individual, societal) - examples Disabilityadjustedlifeyears Health careresourcesuse Loss ofproductivity Absenteeism … (monetarisation) Impact: used in impactassessment, CBA, CEA etc. • Symptoms ofreducedhealth and wellbeing • Respiratorydiseases • IQ loss • Reproductivedisorders • Cancer • Hospital visit/admission • Mortality
Severityofhealtheffect American Thoracic Society. What constitutes and adverse health effect of air pollution? American Journal of Respiratory and Critical Care Medicine, 2000, 161:665–673.
What do weneed to know? Linking health and environment: State oftheenvironment State ofhealth Societalimpact Conceptualization: DPSIR
Investigativeapproaches • Evaluationofindicators • Environmentalhealth surveys • Ex: Czechrepublic – Environmentalhealth survey • Ex: Norway – Severalcohortsestablished • Epidemiological studies • Status: Cross-sectional • Developments: Cohort • Interventional • Occupational
Environmentalhealth status monitoring indicators WHO environmentalhealthindicatorset EEA environmentalindicatorset (Otherinternationalbodies) Suchinvestigationscanprovide a national-levelinformationsuitable for trend analysis The indicatorsfollow DPSIR or itsadaptations
Designing an investigation/survey Define purpose oftheinvestigation Identify relevant healthissue, target population, investigation area Conceptualmodelof ”health” Conceptualmodelof ”exposure” Define type ofinvestigation (repeatedcrossectional, cohort), link between (3) and (4) - dose –responserelationship Define data needsbasedon (3) and (4) Defineprotocols/methods for data generation, collection, storage, retrieval, analysis/reporting
Designing a study: Conceptualmodelofhealth
Conceptualmodels - risk:source-oriented Ott, 1985: conceptual full risk model: Sourceofpollutant Pollutantmovement Exposure Dose Effect
The DPSEEA framework Source: WHO
Exposure Exposure Contact between an agent and a target. Contact takes place at an exposure surface (exposure boundary) over an exposure period. Exposure assessment The process of estimating or measuring the magnitude, frequency, and duration of exposure to an agent, along with the number and characteristics of the population exposed. Ideally, it describes the sources, pathways, routes, and the uncertainties in the assessment. Source: International Program on Chemical Safety - IPCS Risk AssessmentTerminology, http://www.inchem.org/documents/harmproj/harmproj/harmproj1.pdf
Exposure Agent/stressor (energy/mass; medium) Target (objectexposed to agent) Time Contactboundary Contactvolume/concentration/strength Dose: amountof agent thatenters target withspecified time durationaftercrossing a contactboundary
Exposure to air pollutants Model results Concentration and population distribution in spaceSpatial aspectof population exposure Concentration variation in timeTemporal aspect of personal exposure
How to expressexposure: examples • Ambient air: • Monitoring data • Models • Location/zone • Sourceproximity • Indoor air: • Monitoring/sampling • Modeling • Inventoryofpossiblesources: Absence/presenceof smoking • Medicaluse: dose • Products: • Productuse • Food: • Diaryofintakeoffoodstuff • Food basket q, samples • Compound-specific: • Concentration in blood, urine, mother’smilk, hair, otherbiological material
What agents? Examples Primary air pollutants: sulfur dioxide, oxidesof nitrogen, carbonmonoxide, volatile organic compounds, carbonaceous and non-carbonaceousparticles Secondary air pollutants: secondaryparticulate matter (sulfates, nitrates), oxidesof nitrogen, ozone Persistent organicpollutants: Benzene, toluenexylene; polyaromatichydrocarbons; dioxins and dioxin-likesubstances; metals. Other: UV radiation, noise, temperature; radon; environmentaltobaccosmoke
Exposure and RiskManagementMeasures: Influence exposure (often) or influence dose response (seldom). Influencing exposure by …work along the source to intake pathway … change population exposure by changing the number of exposed individuals reducing average exposure levels redistributing exposures qualitatively changing the exposures • at the source by • removing sources • controlling source rates • along the pathway by • restricting or • changing the exposure pathways • and at the target’s behaviour by • reducing exposure frequencies and durations • reducing the intakes
exposure & dose/response Risk assessment intervention +/- issuereevaluation Exposure Scenario is the key issue framing Exposure Scenario Environmental health issue Policy implementation policy development
N Exposure estimates 1 Integrated number of people within areas 2 Individual exposure estimates in micro environments
Exercise #10: Discussion AQ and Health What air pollutants have thegreatestimpacton human health in Qatar (indoor/outdoor)? Why? Whatwasyour personal AQ exposureyesterday (from home to work to home)? – Sourcesindoor and outdoor; relatedpolutants
Scenario development Interventionstrategies Aims and targets Tasks: • Improve air quality • Reduce negative impact on human health • Achieve acceptable air quality • Reduce negative impact on the environment • Assess control options, their feasibility (technical, economic, political) and their costs. • Calculate cost-benefit ratios for options, find best control strategies. • Implement control strategies, • Enforce policies and regulations needed to implement strategies.
Identify problem Pollutant Sources Interventions 1 ........ 2 ........ 3 ......... Reduced emissions Reduced impacts Cost effective priority COST COST Interventionstrategies
Intervention strategies Concentration distributions source impacts from models Identify worst polluters, Sources Area sources Point sources Line sources short, medium long term actions Industries power plants, incinerators Open burning, domestic sources Traffic management Fuel quality, other measures Ban burning, improve fuel, alternatives Identify control options Estimate emission reductions Estimate Cost of actions Estimate Cost of actions Estimate reduced impact Estimate value of improvement CEA CBA Action plan
Introduction of scrubbers; • Shifting to renewable energy (or low sulphur fuel); • Introduction of cleaner technology; • Implementation of process equipment changes and process changes; • Improvement of operating practice; • Ensuring regular maintenance; and • Ensuring maximum energy conservation Sourcereductions - Action plans • Actions defined • Cost of actions • Reduced emissions • Reduced exposure Possible actions: COSTS Emissions reduced
Listing possibleactivites • Combustion • Petroleum industry • Coalgasification • Metalurgicalindustry • Mineral processingind • Organicindustry • Incinerationprocess • Waste handling • Wood and paper • Animal products
Possiblestrategies - compounds Area dependent ! • Industry • Domestic fuel burning • Mine tailings • Transport • Regional air movements • Wildfires and • prescribed burning Other smaller sources that contribute to pollution include: • Landfills • Waste treatment works • Agriculture • Large scale construction • Tyre burning
Reduce emissions - mobile sources • Assess the vehicle fleet; vehicle numbers, type, age and fuel usage. • Ensure the integration of air quality into town planning and future road developments. • Introduce effective transportation measures to reduce air pollution • Include traffic calming (speed humps, roundabouts, traffic islands, traffic light synchronisation ec.) • Provide alternative transportation measures to reduce single-occupancy vehicles. • Development regular emissions testing on all vehicles • Create public awareness of motor vehicle related emissions impacts • Disseminate information on pollution concentrations measured in the city.
Exposure and Impacts Concentration distributions from Dispersion Models Concentrations in microenvironments Collect people’s diaries; time schedules Collect population distributions Estimate population exposure Estimate individual exposure Alternative exposure model Estimate Impacts: Number of objects affected Collect dose/response functions Collect dose/response functions Estimate monetary values of impacts (Cost) Map building materials and vegetation Identify Health end points Reduce emissions Cost/Benefit Estimate value of reduced impact Cost of action Decision
Estimatedose/response • Chronic mortality from PM • Infant mortality from PM • Acute mortality from ozone • Morbidity impacts from PM • Morbidity impacts from ozone • Bronchitis • Asthmas • Acute respiratory diseases, PM, NOx • Hospital admissions • Reduced working days A large number og health end points and pollutants Dose/response functions CAFE CBA 2005
Development in Exposure, Individuals % PeopleExposed
Exposure response relationships for PM Meta-analyses; time series morbidity study in China Aunan & Pan, 2004 EU Cost Benefit Analyses (CAFÉ CBA 2005) Mortality from chronic exposure : 4 % / 10 µg/m3 PM10 (Infant; 0-1 yr)Increase mortality chronic exposure: 6% / 10 µg/m3 PM2,5 (Pope et.al) Respiratory hospital admission : 1 % / 10 µg/m3 PM10 (0-64 yrs)
Cost/benefitprocedure Prioritise: Cost of actions vs. value of improvement
CostofActions Prioritise Input from Stakeholders and Industries Sources – Strategies - Technologies • Update emission data • Validate cost with recent installations • Expand with additional technology • Policy options - compliance date • Dynamic analyses
Possiblehealth end points and pollutants CostofReducedImpacts • Chronic mortality from PM • Infant mortality from PM • Acute mortality from ozone • Morbidity impacts from PM • Morbidity impacts from ozone Europe CAFE CBA 2005
Willingness to pay to avoid an effect Some values for morbidity (€) Pierce et al 1999.
Reduced emissions Reduced exposure Population weighted exposure reduction of TSP for 5 control scenarios (µg/m3 ) Model estimated exposure reductions in 3 cities in Shanxi province China Larssen et.al.
Costeffective SO2options • A.Q. Assessment • Health impacts • Abatement options • Cost/benefit analyses • Optimal abatement strategy Cost effective SO2 options interventions
Cost benefit analysis A comparison of cost-benefit of various control options for SO2 and TSP in Taiyuan
The Complete Air Quality Management System (AQMS) AQMS Establish the GIS based AQM planning system Collect and install digital maps 3 A Collect monitoring data 3 B Undertake emission inventories Prepare input data for models to GIS 3 C Models 4 Interventions 5 Action plans 6 Evaluation
AQMP – update for sustainability Air quality Management plan Air quality master plan AQM Circle Implementation plan Update plan every 5 years Monitoring and Review
In summary: AQ models in planning AQM-programme AQM-system AQM-plan Socio-economic factors: • Urbanisation • Transport & industry • The Climate Change threat Policy Tools: Legislation • Monitoring • Integrated modelling • Scenario building • Validate change Environment: • Emissions • Air quality • Impact Awareness Raising Stakeholder participation Action Plan Enforcement
Atmospheric dispersion models Atmospheric dispersion model Impact Exposure Costs Evaluate: -Area -Topography -Component -Multi source -Gaussian M -Numerical M -Line source M -Trajectory M Select type of model MODEL Complex terrain and climate No Simple Gaussian models Test and verify model performance Yes Select Numerical models Use wind field models Collect air quality data for model verification All input data prepared Collect meteorological data PART 3 B Emission inventories Data from PART 3 A Line Area Point Sources Identify compound to be modelled