Air Quality
330 likes | 473 Views
This document examines the factors influencing odor annoyance levels, including odor strength, air flow, and duration. It emphasizes how proper farmstead and building maintenance can mitigate unpleasant odors. Additionally, it outlines the Clean Air Act's role in regulating national ambient air quality standards for pollutants such as particulate matter, ground-level ozone, carbon monoxide, and nitrogen oxides. The role of the EPA in monitoring these pollutants and their impact on public health is also discussed, along with trends in air quality improvements over recent decades.

Air Quality
E N D
Presentation Transcript
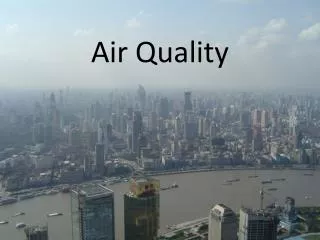
Air Quality October 9, 2013
Odors • The annoyance level of an odor depends on: • Odor strength • Flow rate of the source air stream • Hedonic tone (degree of pleasant/unpleasantness) • Frequency • Duration • Good farmsteads and building hygienic and maintenance can reduce unpleasant odors
Clean Air Act • Requires the EPA to set national ambient air quality standards for: • Particle pollution (particulate matter) • Ground-level ozone • Carbon monoxide • Sulfur oxides • Nitrogen oxides • Lead • Some of these pollutants (CO, SO2, and lead) are emitted directly from a variety of sources
Pollutants Monitored • Most ground-level ozone forms in the air from chemical reactions involving nitrogen oxides (NOx), volatile organic compounds (VOCs), and sunlight • Some industrial sources release ozone directly into the environment, • NO2 is formed in the air through the oxidation of nitric oxide (NO) • PM, also known as particle pollution, can be directly emitted, or it can be formed when emissions of NOx, sulfur oxides (SOx), ammonia, organic compounds, and other gases react in the atmosphere • Particle pollution is regulated as PM2.5, or “fine particles” with diameters less than or equal to 2.5 micrometers, and PM10, which includes all particles with diameters less than or equal to 10 micrometers
EPA Monitoring of Air Quality • EPA sets and reviews national air quality standards • Air quality monitors measure concentrations of ozone throughout the country • EPA has developed ambient air quality trends for each contaminant • EPA, state, tribal and local agencies use that data to ensure that ozone is at levels that protect public health and the environment
Ground-level Ozone (O3) Nationally, average ozone levels declined in the 1980's, leveled off in the 1990's, and showed a notable decline after 2002. For information on ozone standards, sources, health effects, and programs to reduce ozone, please see www.epa.gov/airquality/ozonepollution/.
Ozone • Ozone: Good Up High, Bad Nearby: Ozone acts as a protective layer high above the earth, but it can be harmful to breathe • Ground level or "bad" ozone is not emitted directly into the air, but is created by chemical reactions between oxides of nitrogen (NOx) and volatile organic compounds (VOC) in the presence of sunlight • Emissions from industrial facilities and electric utilities, motor vehicle exhaust, gasoline vapors, and chemical solvents are some of the major sources of NOx and VOC
Carbon Monoxide (CO) • Carbon monoxide (CO) is a colorless, odorless gas emitted from combustion processes, primarily from mobile sources • Health effects – reduction of oxygen delivery to the body's organs (e.g., heart and brain) and tissues • At extremely high levels, CO can cause death • EPA first set air quality standards for CO in 1971
Carbon Monoxide (CO) Average CO concentrations have decreased substantially over the years
Nitrogen Dioxide (NO2) • Nitrogen dioxide (NO2) is one of a group of highly reactive gasses known as "oxides of nitrogen," or "nitrogen oxides (NOx)" • Other nitrogen oxides include nitrous acid and nitric acid • EPA’s National Ambient Air Quality Standard uses NO2 as the indicator for the larger group of nitrogen oxides • NO2 forms quickly from emissions from cars, trucks and buses, power plants, and off-road equipment • Contributes to the formation of ground-level ozone, and fine particle pollution • Health effects: NO2is linked with a number of adverse effects on the respiratory system
Nitrogen Dioxide (NO2) • Average NO2 concentrations have decreased substantially over the years
Particulate Matter (PM) • A complex mixture of extremely small particles and liquid droplets • Particle pollution is made up of a number of components, including acids (such as nitrates and sulfates), organic chemicals, metals, and soil or dust particles • Health effects • The size of particles is directly linked to their potential for causing health problems • Particles that are 10 micrometers in diameter or smaller can pass through the throat and nose and enter the lungs and cause serious health effects • EPA groups particle pollution into two categories: • "Inhalable coarse particles” are from 2.5 to 10 micrometers in diameter, generally found near roadways and dusty industries • "Fine particles" are 2.5 micrometers in diameter and smaller, and include particles found in smoke and haze • Fine particles can be directly emitted from sources such as forest fires, or they can form when gases emitted from power plants, industries and automobiles react in the air
Lead (Pb) • A metal found naturally in the environment and used in manufactured products • The major sources of lead emissions are fuels in on-road motor vehicles (such as cars and trucks) and industrial sources • Average lead concentrations decreased after EPA's regulations reduced the lead content in on-road motor vehicle gasoline • Levels of lead in the air declined by 94 percent between 1980 and 1999 • The major sources of lead emissions to the air today are ore and metals processing and piston-engine aircraft operating on leaded aviation gasoline
Methane (CH4) • Methane is a greenhouse gas that remains in the atmosphere for approximately 9-15 years after released • Global average atmospheric concentrations of methane have increased dramatically since Europeans settled the United States • 1750: approximately 700 parts per billion by volume (ppbv) • 1998: 1,745 ppbv • How big of an increase (%)? • Concern: methane is over 20 times more effective in trapping heat in the atmosphere than carbon dioxide (CO2)
Rate of Methane Increase • Late 1970s: growth rate was 20 ppbv per year • 1980s: growth rate was 9-13 ppbvper year • 1990s: growth rate was 0-13 ppbv • 1990-2002: steady rate of 1751 ppbv Concentration is measured by ppbv; amounts are measured in teragrams (Tg)
Sources and Emissions • Methane (CH4) is emitted from both human-related and natural sources • Natural sources include: • Wetlands (170 Tg/year) • Geologic (mud volcanoes, steam vents, bubbling pools 42-64 Tg/year) • Termites (2-22 Tg/year) • Oceans (2-16 Tg/year) • Gas hydrates (2-9Tg/year) • Wildfires (2-5Tg/year) • Wild animals (ruminants, 15 Tg/year)
Methane EmissionsU.S. human-related Sources Level of emissions from individual sources in the U.S. (units: TgCO2) • Other sources, with emissions in the range of 5 – 10 TgCO2, are: • Forest land • Rice cultivation • Stationary combustion • Abandoned underground coal mines • Human-related sources release significant quantities of methane to the atmosphere • (> 50% of the total)
Livestock Enteric Fermentation • Ruminant animals (cattle, buffalo, sheep, goats, and camels) produce significant amounts of methane as part of their normal digestive processes • Microbial fermentation converts feed into products that can be digested and utilized by the animalin the rumen (large fore-stomach) • Microbial fermentation (enteric fermentation) produces methane as a by-product • Methane is also produced in smaller quantities by the digestive processes of other animals, including humans, but emissions from these sources are insignificant
Livestock Manure Management • Methane is produced during the anaerobic (i.e., without oxygen) decomposition of organic material in livestock manure management systems • Liquid manure management systems (e.g., lagoons and holding tanks) can cause significant methane production • Manure deposited on fields and pastures, or otherwise handled in a dry form, produces insignificant amounts of methane
Wastewater Treatment • Wastewater from municipal sewage and industrial sources is treated to remove soluble organic matter, suspended solids, pathogenic organisms, and chemical contaminants. • These treatment processes can produce methane emissions if organic constituents in the wastewater are treated anaerobically (i.e., without oxygen) and if the methane produced is released to the atmosphere • The sludge produced from some treatment processes may be further biodegraded under anaerobic conditions, resulting in methane emissions • These emissions can be avoided by treating the wastewater and the associated sludge under aerobic conditions or by capturing methane released under anaerobic conditions
Purdue Agricultural Air Quality Laboratory (PAAQL) • The Purdue Agricultural Air Quality Laboratory (PAAQL) is part of the Department of Agricultural and Biological Engineering at Purdue University, West Lafayette, Indiana • PAAQL personnel have been studying the science and engineering of odor, gas, and dust emissions since January of 1994 • Our research has served industry, government and agribusiness, in addition to communities at large
Purdue Agricultural Air Quality Laboratory (PAAQL) Specializes in odor assessment using: • Field and laboratory olfactometry • Chemical analyses using gas chromatography-mass spectrometry with olfactory sensing • Ion chromatography • Closed-cell FTIR spectrometry • Continuous emissions monitoring Odors tested: • Ammonia • Hydrogen sulfide • Carbon dioxide • Methane • Nitrous oxide • Ethanol • Methanol • Particulate matter https://engineering.purdue.edu/~odor/
Current Research • Air Emissions from High Rise and Belt Battery Layer Barns in Ohio • Monitoring particulates and ammonia emissions from two deep pit layer barns and one belt battery layer barn • Characterization and Abatement of Ammonia, Particulate, Pathogen and Odor Emissions from Egg Production Facilities • Test the hypothesis that belt battery barns emit less air emissions than conventional deep pit barns • Quantify effects of litter composting, and wet scrubbers on air emissions from egg production facilities
Odor Based Setbacks • Odor control is a major concern of livestock producers in the United States • The determination of odor-based setbacks for livestock facilities is a difficult and complex problem with only limited supporting data in the U.S. • The use of atmospheric air to dilute odors from livestock facilities by appropriate setback distances is still the most popular and cost-effective strategy to reduce odor nuisance
PAAQL Odor Based Setbacks • A simple-to-use, site-specific setback guideline was developed by Purdue University for U.S. swine production systems • This guideline considers facility size, orientation and shape, wind frequency, land use, topography, building design and management, manure handling characteristics, and odor abatement effectiveness
Disclaimer • The Purdue Agricultural Air Quality Laboratory (PAAQL) has been very involved in developing this guideline • The intricate issues involving odor measurement, dispersion modeling, and lack of in situ validation have hindered the refinement of the guideline • Neither PAAQL nor Purdue University accept any responsibility for any errors in, or for any errors that may results from using the setback guideline • We expressly disclaim any responsibility for any damage arising from the application or reliance on the recommendations and information contained herein
Odor Based Setback Equation Setback distance in feet = 20 F L T V (AEE+ASS)0.5 • where: F = wind frequency factor [0.75 to 1.00]L = land use factor [0.5 to 1.00]T = topography factor [0.8 to 1.00]V = orientation and shape factor [1.00 to 1.15]E = building odor emission, N x P x B, OU/s N = number of pigsP = odor emission factor, OU/s-pig, [1 to 15]B = building design and management factor, M-DM = manure removal frequency [0.50 to 1.00]D = manure dilution factor [0.00 to 0.20]S = odor emission from outdoor storage, C x G, OU/s, C = odor emission factor for outside liquid manure storage [50 OU/s-AU]G = animal unit, AU=1,100 lb of pig weightAE = odor abatement factor for buildings [0.30 to 1.00]AS = odor abatement factor for outside liquid manure storage [0.30 to1.00]
Laboratory Facilities - Olfactometry • Panelists evaluate intensity and Hedonic tone at recognition and at full strength • Intensity is measured on a scale of 0 to 5 where • 0 has no perceivable odor and 5 has an extremely strong odor • Intensity levels are determined by comparing to a reference odorant, n-butanol • Hedonic tone is the pleasantness or unpleasantness of an odor • The scale ranges from -10, extremely unpleasant through +10, extremely pleasant • Eight trained panelists are used to evaluate each odor sample
AQI Forecast • Air quality monitors measure concentrations of air pollutants throughout the country • The EPA, state, tribal and local agencies use that data to ensure that pollutant levels that protect public health and the environment • www.airnow.gov/