Download
1 / 6
60 likes | 87 Views
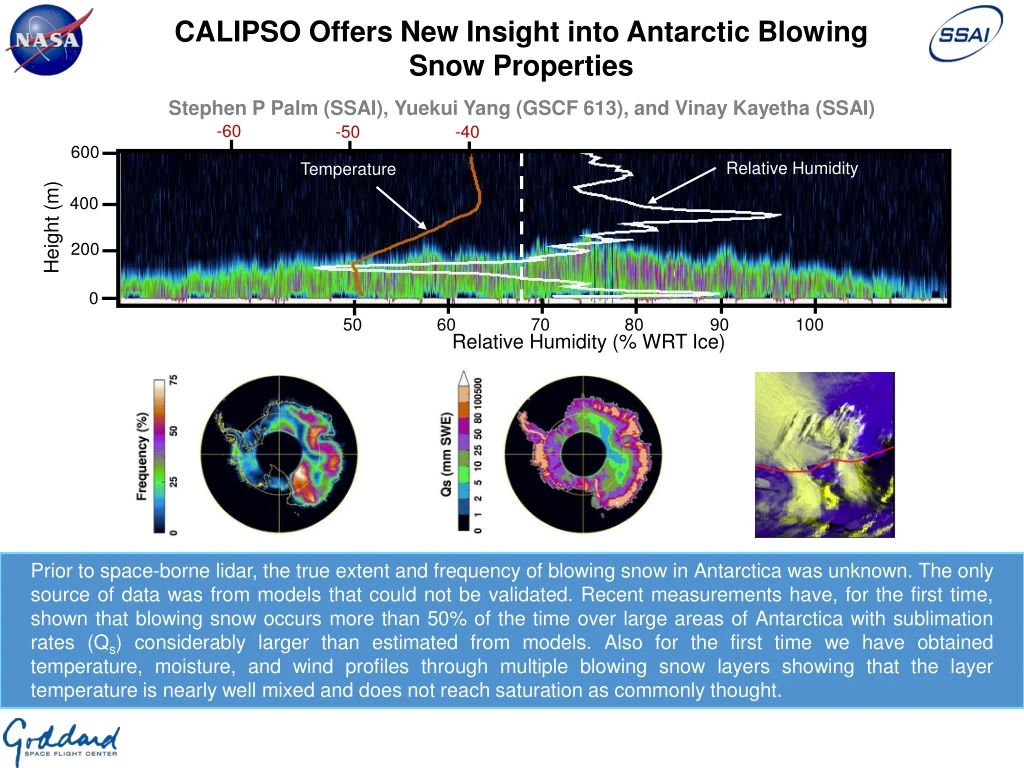
This study utilizes CALIPSO lidar measurements to reveal new information about blowing snow in Antarctica. The research shows that blowing snow occurs over 50% of the time with sublimation rates larger than previously estimated. The study also provides temperature, moisture, and wind profiles of blowing snow layers. The findings have implications for understanding the mass balance of ice sheets and the hydrological cycle in high latitudes.

E N D
CALIPSO Offers New Insight into Antarctic Blowing Snow Properties Stephen P Palm (SSAI), Yuekui Yang (GSCF 613), and Vinay Kayetha (SSAI) -60 -50 -40 600 Relative Humidity Temperature 400 Height (m) 200 0 50 60 70 80 90 100 Relative Humidity (% WRT Ice) Prior to space-borne lidar, the true extent and frequency of blowing snow in Antarctica was unknown. The only source of data was from models that could not be validated. Recent measurements have, for the first time, shown that blowing snow occurs more than 50% of the time over large areas of Antarctica with sublimation rates (Qs) considerably larger than estimated from models. Also for the first time we have obtained temperature, moisture, and wind profiles through multiple blowing snow layers showing that the layer temperature is nearly well mixed and does not reach saturation as commonly thought.
Name: Stephen Palm, SSAI, NASA/GSFC and code 612 E-mail: stephen.p.palm@nasa.gov Phone: 301-614-6276 References: Palm, S.P., V. Kayetha, Y. Yang and R. Pauly (2017), Blowing snow sublimation and transport over Antarctica from 11 years of CALIPSO observations. The Cryosphere. https://doi.org/10.5194/tc-11-2555-2017. Palm, S. P., V. Kayetha and Y. Yang (2018), Toward a satellite-derived climatology of blowing snow over Antarctica. J. Geophys. Res. Atmos. 123. https://doi.org/10.1029/2018JD028632 Palm, S. P., Y. Yang, V. Kayetha and J. Nicolas (2018), Insight into the thermodynamic structure of blowing snow layers in Antarctica from dropsonde and CALIPSO measurements. J. Appl. Meteor Clim., DOI: 10.1175/JAMC-D-18-0082.1 Data Sources: The level-1B calibrated attenuated backscatter data (V4-00) from the Cloud–Aerosol Lidar with Orthogonal Polarization (CALIOP) aboard the Cloud–Aerosol Lidar and Infrared Pathfinder Satellite Observations (CALIPSO) satellite obtained from the NASA Langley Atmospheric Science Data Center (ASDC). Blowing snow data is now available from the Langley ASDC. Dropsonde data acquired during the 2010 French Concordiasi Project were obtained from the NCAR Earth Observing Laboratory under the sponsorship of the National Science Foundation (https://data.eol.ucar.edu/dataset/221.002). MODIS data were obtained from https://modis.gsfc.nasa.gov/data/ Technical Description of Figures: Graphic 1: (Top) CALIPSO calibrated backscatter from a typical Antarctic blowing snow layer with the temperature (red) and relative humidity profiles (white) as measured by a dropsonde that fell through the layer at the approximate position of the vertical dashed line. The total length of the blowing snow layer is about 400 km and its depth averages about 200 m. Graphic 2: (Bottom left) Average wintertime (April – October) blowing snow frequency for the Antarctic continent as determined from 11 years of CALIOP data (2006 – 2017). Graphic 3:(Bottom middle) Average annual blowing snow sublimation (Qs) for the Antarctic continent from 11 years of CALIOP data (2006 – 2017). Graphic 4: (Bottom right) MODIS false color image showing blowing snow being carried off the Antarctic continent. The red line is the approximate position of the coastline. The total mass of snow carried off the continent exceeds 3.5 Gt per year. Scientific significance, societal relevance, and relationships to future missions: This work utilizes CALIPSO lidar measurements to directly detect the presence of blowing snow. We show that it occurs over 50% of the time over large areas of Antarctica in winter and reaches heights as high as 500 m. A notable discovery is the existence of very large blowing snow “storms” – up to the size of the state of Texas – that act to transport huge quantities of snow from the continent to the surrounding ocean and sea ice. We have estimated that as much as 3.7 billion tons of snow is transported from continent to ocean by the wind each year. The transport and sublimation of blowing snow is an important component of the mass balance of the Antarctic ice sheet. Our results show that blowing snow sublimation accounts for over 350 billion tons of snow per year sublimated into the Antarctic atmosphere. This is nearly twice the model estimate of previous studies. This is important for two reasons: 1) The transport and sublimation of blowing snow are essential but not well understood components of the mass balance of ice sheets. As the climate changes, we will need to more accurately assess the mass balance of the ice sheets that cover Antarctica and Greenland to better predict sea level rise. 2) Blowing snow sublimation is an important part of the hydrological cycle in high latitudes (in the Arctic as well as Antarctica) where most of the precipitation falls as snow. The techniques developed for detecting blowing snow using CALIPSO data are now being used to analyze ICESat-2 data and the blowing snow retrievals will be part of the atmospheric data products. These results will extend the climate record of blowing snow established by CALIPSO (2006 – present) into the next decade. The CALIPSO blowing snow data have recently been made publicly available at the NASA Langley Atmospheric Science Data Center (ASDC) and ICESat-2 data will be available from the National Snow and Ice Data Center (NSIDC) in Boulder, Colorado in May, 2019. Earth Sciences Division - Atmospheres
The subgrid variability of precipitation in different cloud systems Jackson Tan1,2, Lazaros Oreopoulos1 1 NASA/GSFC 613, 2 USRA By compositing IMERG precipitation by cloud regime (CR) as identified by MODIS, we can identify how much precipitation is associated with different cloud systems near-globally (left). The higher spatial resolution of IMERG allows us to compute the areal fraction of each CR’s precipitation (right). The combined perspective demonstrates that some CRs have intense but sporadic precipitation (CR1), and that even the wettest cloud regime (CR2) precipitates in only half its area on average—a testament to rainfall’s high spatial variability.
Name: Jackson Tan, NASA/GSFC, Code 613, USRA E-mail: jackson.tan@nasa.gov Phone: 301-614-6227 References: Tan, J., and L. Oreopoulos, 2019: Subgrid Precipitation Properties of Mesoscale Atmospheric Systems Represented by MODIS Cloud Regimes. J. Climate, 32, 1797–1812, doi:10.1175/JCLI-D-18-0570.1. Oreopoulos, L., N. Cho, D. Lee, and S. Kato, 2016: Radiative effects of global MODIS cloud regimes. Journal of Geophysical Research: Atmospheres, 121, 2299–2317, doi:10.1002/2015JD024502. Huffman, G. J., and Coauthors, 2018: Algorithm Theoretical Basis Document (ATBD) Version 5.2. NASA Global Precipitation Measurement (GPM) Integrated Multi-satellitE Retrievals for GPM (IMERG). NASA, https://pmm.nasa.gov/data-access/downloads/gpm. Data Sources: MODIS Cloud Regimes dataset; IMERG precipitation dataset. Technical Description of Figure: Left panel: the average grid-mean precipitation rates of various MODIS cloud regimes (CRs) from Terra (morning) and Aqua (afternoon). Most CRs—such as the stratocumulus regimes (CR8-11)—are generally nonprecipitating, with most of the global precipitation coming from a handful of atmospheric systems, organized convection (CR2), summer extratropical storms (CR4), and isolated convection (CR1), and being generally heavier in the afternoon. Right panel: Precipitation structure within occurrences of the atmospheric system made possible by the high resolution of precipitation observations, expressed as the areal fraction that is precipitating, on average. There are several salient precipitation characteristics of these systems that can be drawn from this new perspective. The difference between the precipitating area of summer extratropical storms (CR4) and isolated convection (CR1) is larger than that of the grid-mean precipitation rate, indicating that isolated convection tends to be more intense but sporadic. On the other hand, even the intense organized convection has precipitation over, on average, only 50% of its area, demonstrating the high spatial heterogeneity of precipitation. Scientific significance, societal relevance, and relationships to future missions: A cloud field spanning across 100 km usually contains a mixture of cloud types and the precipitation reaching the surface will vary widely. It can be intense but sporadic, or it can be light but widespread. It can be convective or stratiform, or mixture of both. Moreover, it can vary in phase: rainfall, snowfall, or mixed phase. CRs provide an objective way of classifying cloud fields globally based on the distribution of their properties into mesoscale atmospheric systems such as organized convection, extratropical storms, and stratocumulus fields. Previous studies have analyzed CR grid-mean precipitation—that is, the average precipitation over the entire system—demonstrating the distinct amount of precipitation produced by these systems. Here, in a synthesis of two NASA datasets, we take a further step by leveraging the high resolution of IMERG (0.1° × 0.1°) to examine the precipitation structures within these systems as observed by MODIS (1° × 1°). With 100 points of precipitation values in each MODIS cloud regime, how precipitation varies within the system is revealed. For example, organized convective systems—known to produce the most precipitation of all systems—are precipitating over only about half the area on average. In the extratropics, summer storms produce more precipitation than winter storms despite having similar cloud patterns. The intensity of isolated thunderstorms is balanced out by the low area coverage so their contribution to global precipitation is small. These insights reveal the nature of different atmospheric systems globally, contributing towards our understanding of the atmosphere in the real world and providing guidance into how they are represented in numerical models. These results illustrate the importance in improving our knowledge on the relationship between clouds, convection, and precipitation, which are designated observables in the 2017 Decadal Survey. Earth Sciences Division - Atmospheres
Recent global warming as confirmed by AIRS Background: How robust are surface temperature trends derived from weather stations and ocean buoys (such as from NASA GISTEMP)? Analysis: Using ground temperature anomalies from the AIRS instrument on Aqua(2003+) trends and monthly anomalies show a very strong correspondence w/GISTEMP over most of the world. Higher resolution AIRS data has more detail, global & regional trends are very coherent. Places with less correlation (central Africa, Southern Oceans, Arctic) have sparser station data. Station-based analysis may be underestimating Arctic warming. Goddard Space Flight Center Sciences and Exploration Directorate Earth Sciences Division National Aeronautics and Space Administration Goddard Institute for Space Studies J Susskind et al. (2019) Environ. Res. Lett. 14 044030, doi:10.1088/1748-9326/aafd4e
E-mail: joel.susskind-1@nasa.gov; gavin.a.schmidt@nasa.gov Phone: 301.286.7210; 212.678.5627 Susskind, J., G.A. Schmidt, J.N. Lee, and L. Iredell, 2019: Recent global warming as confirmed by AIRS. Environ. Res. Lett., 14, no. 4, 044030, doi:10.1088/1748-9326/aafd4e Data Sources: AIRS version 6 skin temperature data and the GISS Surface Temperature product (GISTEMP) are used in this analysis.AIRS data reflects skin temperature at the surface of the ocean, land, and snow/ice covered regions. Surface-based data are a blend of two meter surface air data anomalies over land, and bulk sea surface temperature anomalies in the ocean. Technical Description of Figures: Graphic 1 (bottom left): Global mean anomalies for the AIRS and GISTEMP data sets are shown for January 2003 through December 2017 along with three other selected in situ data products (HadCRUT4, Cowtan and Way, and ECMWF). Dashed lines are the ordinary least squares trends of the anomaly time series for AIRS and GISTEMP over this time period. Graphic 2 (right): Spatial plots (a) and (b) show 15-year trends of AIRS and GISTEMP surface temperatures in (oC) /decade. Spatial Plots(c) and (d) show AIRS and GISTEMP December 2017 surface temperature anomalies. Maps using (e) monthly, and (f) annual show temporal correlations between AIRS and GISTEMP (calculated on a 2° × 2° grid) over the 15 year period. Scientific significance, societal relevance, and relationships to future missions: The GISTEMP data set, and the totally independent satellite-based AIRS surface skin temperature data set, are very consistent with each over the past 15 years. Both data sets demonstrate that the Earth's surface has been warming globally over this time period, and that 2016, 2017, and 2015 have been the warmest years in the instrumental record, in that order. In addition to being an independent data set, AIRS products complement those of GISTEMP because they are at a higher spatial resolution than those of GISTEMP and have more complete spatial coverage, but with a shorter record. Differences in the products (and lower temporal correlations) mostly reflect areas without much directly observed station data (the Arctic, Southern Ocean, sub-Saharan Africa) suggesting that the fault lies in the station-based products rather than with the AIRS data. Notably, surface-based data sets may be underestimating the changes in the Arctic. Complementary satellite-based surface temperature analyses serve as an important validation of surface-based estimates, and they may point the way to make improvements in surface-based products that can perhaps be extended back many decades. Goddard Space Flight Center Sciences and Exploration Directorate Earth Sciences Division National Aeronautics and Space Administration Goddard Institute for Space Studies