Download
1 / 30
310 likes | 625 Views
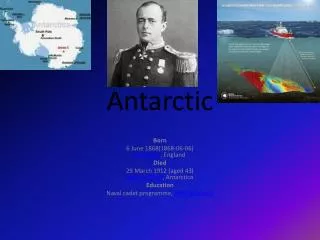
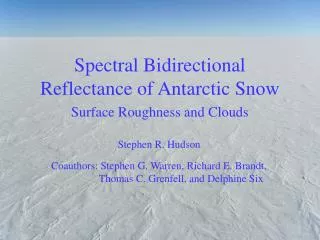
Spectral Bidirectional Reflectance of Antarctic Snow. Measurements and Parameterisation. Stephen R. Hudson. Coauthors: Stephen G. Warren, Richard E. Brandt, Thomas C. Grenfell, and Delphine Six. Location. Dome C 75°S, 123°E, 3250 m

E N D
Spectral Bidirectional Reflectance of Antarctic Snow Measurements and Parameterisation Stephen R. Hudson Coauthors: Stephen G. Warren, Richard E. Brandt, Thomas C. Grenfell, and Delphine Six
Location • Dome C 75°S, 123°E, 3250 m • Very small surface slope results in light winds and small surface roughness • Cold, fine-grained snow all year • Similar surface to most of East Antarctic Plateau above 3000 m
Motivation • Surface reflectance data from Dome C are representative of a large, temporally-stable, and spatially-homogeneous area • For these reasons, this region has been used as a satellite calibration target • Remote sensing products for Antarctica, including satellite cloud detection, will benefit from a better model of the surface reflectance properties
Instrumentation • Analytical Spectral Devices FieldSpec Pro JR 350 to 2500 nm with 3- to 30-nm resolution
Measurement Technique • All observations were made from 32 m above the surface to ensure a representative measurement footprint
Albedo of Snow • High in the UV, visible, and NIR to about 1000 nm, low and more variable beyond that • The BRDF of the snow is similar at all wavelengths with the same albedo
Data ~ High Sun • Anisotropic reflectance factor (R)
Data ~ Low Sun • More anisotropic with low albedo and large solar zenith angle
Parameterisation • Use our spectral observations at 96 solar zenith angles to develop simple parameterisations to calculate R(qo,l,q,f) • The parameterisations use the empirical orthogonal functions (EOFs) of the data matrix as their basis functions • The coefficients to linearly combine the EOFs were fit to simple functions of qo and either l (UV, VIS, NIR) or a (l ≥ 950 nm)
Parameterisation Results • The parameterisation matches the shape and magnitude of the data quite well
Parameterisation Results • Errors between the parameterisation and individual observations are not much larger than the expected uncertainties of the data
Parameterisation Results • The parameterisation reproduces the higher anisotropy at wavelengths with moderately low albedo fairly well
Parameterisation Results • The largest errors tend to be at large viewing zenith angles–those least likely to be used for remote sensing
Parameterisation Results • At wavelengths less than 1400 nm the parameterisation works well to solar zeniths angles of 86° (the limit of our data)
Parameterisation Results • The error, between the parameterisation and individual observations, and the uncertainty of the data are both larger at large qo and low a
Summary of Parameterisations • We developed six parameterisations for different subsets of the data • They cover all observed qo for wavelengths 350 to 1400 nm and qo≤ 75° for wavelengths 1450 to 2400 nm with a > 0.15 • The RMS error for the parameterisations ranges from 2% to 8%
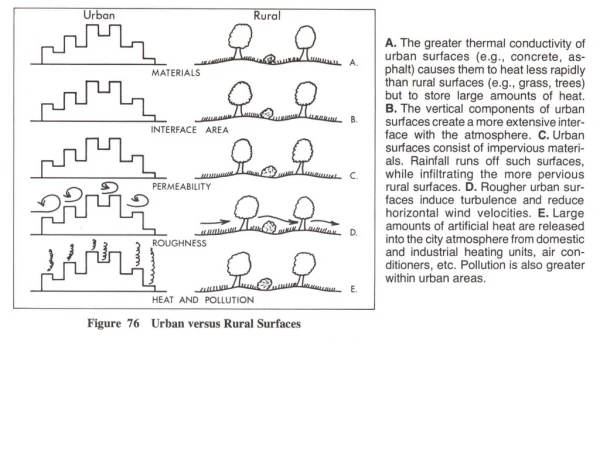
Effect of Surface Roughness • The observed patterns of R differ dramatically from those predicted by radiative transfer models
Effect of Surface Roughness • The amount of forward-escaping radiation is reduced because the observer facing the sun sees the shaded sides of roughness elements • The backscatter is increased because the solar zenith angle is effectively reduced for faces of roughness elements that face the sun
Effect of Cloud • Some observations were made at times with shallow radiation fog to examine the effect of fog or cloud on the BRDF of snow
Effect of Cloud • Cloud over the snow significantly enhances the forward scattering, while slightly reducing the scattering into other directions
Modelling Cloud Over Snow • Placing a thin cloud above the parameterised snow surface in DISORT produces output that is much more similar to the observation
Modelling Cloud Over Snow • The top of the fog is much smoother than the snow surface, so DISORT can adequately model this situation if the snow BRDF is specified
Summary • An extensive set of directional-reflectance data was collected on the high East Antarctic Plateau • These data were used to develop a parameterisation for the anisotropic reflectance factor of the snow in this region that is valid over a broad spectral range and at most solar zenith angles encountered in Antarctica
Summary • The natural surface roughness of the Antarctic snow surface makes the reflected radiation field less anisotropic than that predicted by RT models for a flat snow surface • Placing a cloud over the snow masks some of this roughness and allows RT models to perform better, especially if the surface BRDF is specified with the parameterisation
Acknowledgements • Michel Fily at the Laboratoire de Glaciologie et Géophysique de l’Environnement sponsored our work at Dome C • Logistics were provided by l’Institut Polaire Français Paul Emile Victor, Il Programma Nazionale di Ricerche in Antartide, and the National Science Foundation Paper has been submitted to JGR Atmospheres. email: hudson@atmos.washington.edu
Measurement Technique • Undisturbed snow over 255° of azimuth • Two methods to complete patterns: 1. Reflect across principal plane 2. Combine two observations
Empirical Orthogonal Functions • Linear combinations of these two patterns can represent 98% of the variance in the dataset with l ≤ 900 nm, qo ≤ 75°
Fitting the Coefficients • The coefficients to combine the EOFs to correctly represent the data were then parameterised as functions of solar zenith angle and either wavelength or albedo