Normal Distributions for Probability Analysis
Explore bell-shaped continuous probability distributions, properties of the normal curve, and the Empirical Rule for data values within standard deviations. Learn how to interpret graphs and calculate probabilities accurately.


Normal Distributions for Probability Analysis
E N D
Presentation Transcript
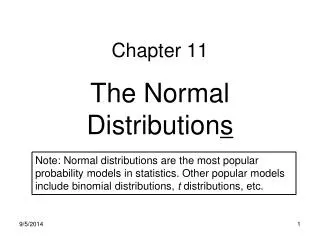
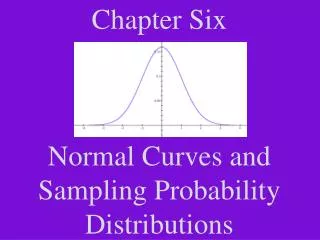
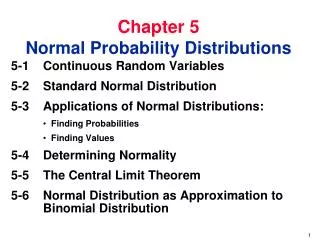
Chapter 6: Normal Distributions Section 1: Probability Distributions Graphs of Normal
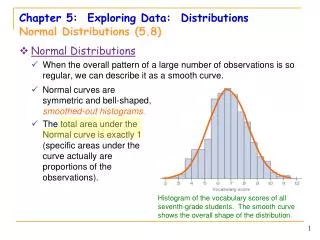
Properties of a Normal Curve • represents continuous probability distributions • bell-shaped with the highest point over the mean • symmetrical about a vertical line through the mean (Continued on next slide)
curve approaches the horizontal axis but never touches or crosses it • area beneath the curve is exactly one • probability distribution given by the formula f(x)= π = 3.1416e = 2.7183
the portion of the area under the curve above a given interval represents the probability that a measurement will lie in that interval
Empirical Rule For a distribution that is symmetrical and bell-shaped (a normal distribution) : * Approximately 68% of the data values will lie within one standard deviation on each side of the mean. * Approximately 95% of the data values will lie within two standard deviations on each side of the mean. * Approximately 99.7% of the data values will lie within three standard deviations on each side of the mean.