Statistics Chapter 2 Exploring Distributions
Section 2.1 Visualizing Distributions: Shape, Center and Spread. Statistics Chapter 2 Exploring Distributions. Section Objectives. To learn the basic shapes of distributions of data: Uniform, normal and skewed To describe characteristics of a shape of distribution:

Statistics Chapter 2 Exploring Distributions
E N D
Presentation Transcript
Section 2.1 Visualizing Distributions: Shape, Center and Spread StatisticsChapter 2 Exploring Distributions
Section Objectives • To learn the basic shapes of distributions of data: • Uniform, normal and skewed • To describe characteristics of a shape of distribution: • Symmetry, skewness, modes, outliers, gaps and clusters • To describe a uniform distribution using range and frequency • To estimate graphically the mean and standard deviation of a normal distribution and use them to describe the distribution. • To estimate graphically the median and quartiles and use to describe a skewed distribution.
What is a Distribution? • A graph that shows: • Spread of the data • How many times a value in the data occurs • How have we used a distribution? • To see where data from a simulation lies. • To explore probabilities of a random selection
Basic Shapes of a Distribution • Uniform (Rectangular) • All values occur equally often • Selecting the last digit of the numbers in a phone book • Selecting the last digit of social security #s or you student id #s • randInt(start,end,n) ie: randInt(0,9,100) L1 • Why? • All digits 0-9 would be used and there would be no reason any one of them would be used more than the others.
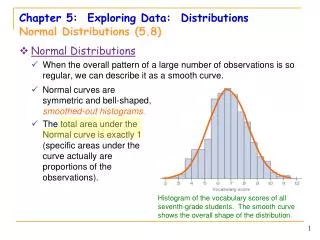
Basic Shapes of a Distribution • Normal Distributions (bell-shaped) • Very common in our world and will be used throughout the year. • Normal Distribution Video #1 • Normal Distribution Video #2 • Why do you think that occurred?
Basic Shapes of a Distribution • Characteristics of a Normal Distribution: • Symmetric: The mean (avg. value) of the data is the center point. If it is truly normal, the mode and median of the data is also at the center. • These are called measures of center. • Standard deviation (SD) is a measure of the spread of a normal distribution. The SD happens to be the distance from the center out to the inflection point on the curve. • One SD out from the center in both directions will give boundaries for an area of 68% of the total under the curve. • This is a measure of the spread of the data.
Basic Shapes of a Distribution • Skewed distribution (a longer tail on one side) • Skewed right: tail stretches to the right • Not a line of symmetry • Median is typically used to describe a measure of center since there is not line of symmetry. • Divide the plot into equal #s of data points on each side of the median. • Quartiles are a measure of spread for this. • Lower quartile divides the lower half of the data • Upper quartile divides the upper half of the data
Basic Shapes of a Distribution • Bimodal Distributions (two peaks) • Cases often represents two groups when this occurs: Male/Female, Majority/Minority… • Outliers: A data value that stands apart from the bulk of the data. • These deserve special attention • Sometimes they are mistakes • Sometimes there are unusual circumstances that can be important to great discoveries.
Basic Shapes of a Distribution • Gaps in where the data values lie. • Could also call the areas where the bulks of the data lie, clusters.
Characteristics to describe a Distribution • When describing a distribution, you must include the following: • Shape (as we have just described) • Measure of center (or centers if bimodal) • mean, mode, median • Measure of spread • Locations of Gaps or Clusters
Practice Problems • Discussion D4 • Practice P1-3, 5
Homework • Page 39 E1, 3, 5, 8, 11 • AP only: also E4, and 6