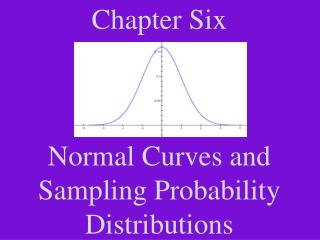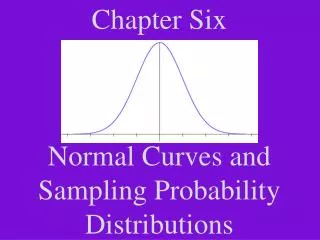
Chapter Six Normal Curves and Sampling Probability Distributions
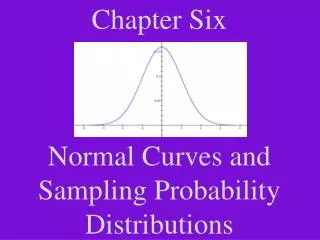
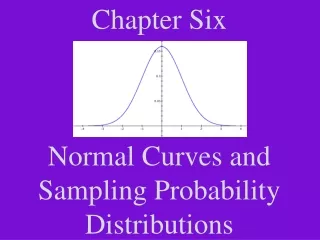
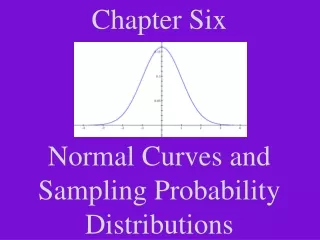
Chapter Six Normal Curves and Sampling Probability Distributions. Chapter 6 Section 1 Graphs of Normal Probability Distributions. Properties of The Normal Distribution. The curve is bell-shaped with the highest point over the mean, μ. Properties of The Normal Distribution.


Chapter Six Normal Curves and Sampling Probability Distributions
E N D
Presentation Transcript
Chapter SixNormal Curves and Sampling Probability Distributions
Chapter 6 Section 1 Graphs of Normal Probability Distributions
Properties of TheNormal Distribution The curve is bell-shaped with the highest point over the mean, μ.
Properties of The Normal Distribution The curve is symmetrical about a vertical line through μ.
Properties of The Normal Distribution The curve approaches the horizontal axis but never touches or crosses it.
Properties of The Normal Distribution The transition points between cupping upward and downward occur above μ + σ and μ – σ .
The Empirical Rule Approximately 68.2% of the data values lie within one standard deviation of the mean.
The Empirical Rule Approximately 95.4% of the data values lie within two standard deviations of the mean.
The Empirical Rule Almost all (approximately 99.7%) of the data values will be within three standard deviations of the mean.
The Empirical Rule Percentages of data that lies between given values
Application of the Empirical Rule Question: What is the probability that a light bulb of this type will last between 1000 and 1200 hours? The life of a particular type of light bulb is normally distributed with a mean of 1100 hours and a standard deviation of 100 hours. Answer:Approximately 0.6820
Application of the Empirical Rule Question: What is the probability that a light bulb of this type will last between 950 and 1325 hours? The life of a particular type of light bulb is normally distributed with a mean of 1100 hours and a standard deviation of 75 hours. Answer:Approximately 0.9755
Application of the Empirical Rule Answer:Approximately 0.3410
Application of the Empirical Rule Answer:Approximately 0.8180
Application of the Empirical Rule Answer:Approximately 0.0215
Application of the Empirical Rule Answer:Approximately 0.0230
Application of the Empirical Rule Answer:Approximately 0.0015
Control Chart A statistical tool to track data over a period of equally spaced time intervals or in some sequential order.
Statistical Control A random variable is in statistical control if it can be described by the same probability distribution when it is observed at successive points in time.
To Construct aControl Chart • Draw a center horizontal line at μ. • Draw dashed lines (control limits) at μ±2σ and μ±3σ. • The values of μ and σ may be target values or may be computed from past data when the process was in control. • Plot the variable being measured using time on the horizontal axis.
Control Chart μ+3σ μ+2σ μ μ-2σ μ-3σ
Out-Of-ControlWarning Signals • One point beyond the 3σ level. • A run of nine consecutive points on one side of the center line. • At least two of three consecutive points beyond the 2σ level on the same side of the center line.
Is the Process in Control? μ+3σ μ+2σ μ μ-2σ μ-3σ
Is the Process in Control? μ+3σ μ+2σ μ μ-2σ μ-3σ
Is the Process in Control? μ+3σ μ+2σ μ μ-2σ μ-3σ
Is the Process in Control? μ+3σ μ+2σ μ μ-2σ μ-3σ
Is the Process in Control? μ+3σ μ+2σ μ μ-2σ μ-3σ
Is the Process in Control? • Do any points fall beyond the LCL and UCL three standard deviation limits? • No points fall beyond the LCL and the UCL three standard • deviations limit. • Is there a run of nine consecutive points on one side of the center line? • There is no run of nine consecutive points on one side of the • center line. • Is there an instance of two out of three points beyond the two standard deviation limits on the same side of the center line? • There is no instance of two out of three points beyond the two standard deviation limits on the same side of the center line.
THE END OF SECTION 1 Homework Assignments Pages: 259 - 266 Exercises: #1 - 19, odd Exercises: #2 - 20, even