Download
1 / 28
280 likes | 412 Views
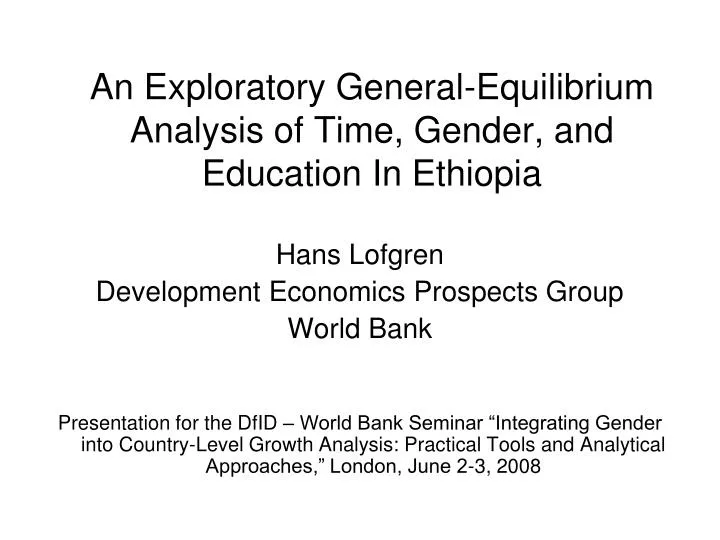
An Exploratory General-Equilibrium Analysis of Time, Gender, and Education In Ethiopia. Hans Lofgren Development Economics Prospects Group World Bank

E N D
An Exploratory General-Equilibrium Analysis of Time, Gender, and Education In Ethiopia Hans Lofgren Development Economics Prospects Group World Bank Presentation for the DfID – World Bank Seminar “Integrating Gender into Country-Level Growth Analysis: Practical Tools and Analytical Approaches,” London, June 2-3, 2008
INTRODUCTION • Purposes: • Method: develop MAMS (Maquette for MDG Simulations) for gender • Empirical: explore gender policy in Ethiopia • Outline • MAMS • Ethiopia application • Conclusions
1. MAMS • Developed for MDG analysis; turned into general framework for country-level, medium-to-long-run development policy analysis. • First application to gender.
Model Structure • MAMS is an extended, dynamic-recursive computable general equilibrium (CGE) model designed for MDG analysis. • MAMS is complementary to and draws extensively on sector and econometric research on MDGs. • Motivation behind the design of MAMS: • An economywide, flexible-price model is required for development strategy analysis. • Standard CGE models provide a good starting point. • But Standard CGE approach must be complemented by a satisfactory representation of 'social sectors'. 1. MAMS
General Features • Many features are familiar from other CGE models: • Computable solvable numerically • General economy-wide • Equilibrium • optimizing agents have found their best solutions subject to their budget constraints • quantities demanded = quantities supplied in factor and commodity markets • macroeconomic balance • Dynamic-recursive the solution in any time period depends on current and past periods, not the future. • A “real” model: only relative prices matter; no modeling of inflation or the monetary sector. 1. MAMS
MDGs • Extended to capture the generation of MDG outcomes. • MAMS covers MDGs 1 (poverty), 2 (primary school completion), 4 (under-five mortality rate), 5 (maternal mortality rate), 7a (water access), and 7b (sanitation access). • The main originality of MAMS compared to standard CGE models is the inclusion of (MDG-related) social services and their impact on the rest of the economy. • Social services (education at different levels, health, and water-sanitation) may be produced by the government and the private sector. 1. MAMS
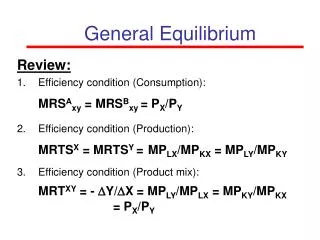
The engendered version of MAMS … (1) • covers full time use (net of personal care time) of population in labor-force age, disaggregated by gender, education, activity (different GDP activities, home services, leisure). • disaggregates the different education levels and their links to the labor market by gender • nests the demand for labor – see figure. Rationale: Need to consider responses in employment by gender to changes in relative wages. 1. MAMS
Labor nesting 1. MAMS
The engendered version of MAMS … (2) • has special treatment of leisure and home services: • commodities disaggregated by gender and education • only demanded by the household • each commodity produced with one kind of labor as input (no consideration of substitutability in production) • per-capita quantities from different labor types are rigid (limited responses to changes in incomes and wages) • has fixed total per-capita demand for home service outputs; labor time responds to productivity changes. • Non-neoclassical treatment justified by the special nature of leisure and home services: • norms important in time allocation by gender and education • leisure produced and consumed by the same person. 1. MAMS
The engendered version of MAMS … (3) • Across all GDP activities, wage discrimination against females: • wage paid < marginal value product (MVP). • surplus (the gap) paid to male labor. • Treatment justified by need to consider: • the fact that economic benefits of increasing female employment > financial benefits reaped by female workers; • impact or reduced discrimination (direct on earnings; indirect on broader indicators, considering differences in male and female spending patterns) 1. MAMS
2. Ethiopia application • Development of database matching model characteristics: • disaggregating payments and accounts related to labor and leisure in the SAM; • creating separate time accounts that match SAM payments; and • disaggregating education-related data by gender (accounting for the situation in the base-year and gender-specific responses to changes in the determinants of educational outcomes)
Disaggregation for Ethiopia (1) • Sectors (activities and commodities): • Government: education (four cycles); health, water-sanitation; other infrastructure; other • Non-government GDP: agriculture, industry, private health services, other private services • Non-government non-GDP: home services, leisure (by gender and education) 2. Ethiopia application
Disaggregation for Ethiopia (2) • Factors • Labor (by gender and education) • Government capital (by government sector) • Private capital • Agricultural land • Institutions • Household • NGO • Government • Rest of World 2. Ethiopia application
Simulations: period and description • Period: 2005-2030. • Description: see table below. 2. Ethiopia application
Description of simulations 2. Ethiopia application
Results: BASE • Macro: • aggregates grow at rates in the range of 5-7%; • increased share of domestic taxes in GDP. • Education: • enrollment grows more rapidly the higher the cycle and for females; female/male GERs increase; • Labor: • employment: female (in GDP) grows more rapidly than male; the higher the level of education, the more rapid growth. • wages: female grow less rapidly than male at all education levels • Time use: • for all groups, time share for GDP activities increase at the expense of home services; the reduction is larger, the higher the level of education, and much larger for females than males 2. Ethiopia application
Results: EDTX (tax-financed education expansion) • Macro: • dramatic increase in GDP share of domestic taxes (from 11% to 20%); • real GDP growth increases by 0.2 %-age points per year. • increased growth for government demand (1.4-1.8 %-age points), decreased growth for private (by 0.2-0.4 %-age points) • Education: for secondary and tertiary, strong increases in enrollment growth and GERs (by 8-11 %-age points) • Labor: • employment: slight growth decline at the lowest education; more rapid growth at higher levels (esp. tertiary level and esp. for females) • wages: inverse relation between changes in employment and wage growth 2. Ethiopia application
Results: ED (aid-financed education expansion) • Macro – compared to BASE: • no change in GDP share of domestic taxes; foreign aid GDP share increases by 7.5 %-age points. • real GDP growth increases by 0.6 %-age points per year. • increased growth for government demand (1.7-2.1 %-age points), increased growth for private (by 0.4-0.8 %-age points) • Education – compared to EDTX: outcomes similar to but slightly stronger; • Labor – compared to EDTX: • employment: only small changes in growth • wages: stronger growth across the board 2. Ethiopia application
Results: ED+EL (less gender bias) • Compared to ED, minimal changes except for relative male/female wages – see figure below. 2. Ethiopia application
Results: ED+EL (less gender bias) 2. Ethiopia application
Results: ED+EL+HP (increased home service productivity) • Macro – compared to ED+EL: growth increases for GDP and all parts of domestic final demand (by 0.3-0.7 %-age points); • Labor – compared to ED+EL: • Employment: increased supply of market labor, especially for females with the least education • Wages: wages for most labor types grow more rapidly as a result of the acceleration of over-all growth; downward pressure on wages for females with the least education; • Time use – compared to ED+EL: home service shares decline (by 4-15 %-age points) in proportion to original shares of each labor type; most of the saved time moves into GDP production; 2. Ethiopia application
Results: ED+EL+HP+PP (increased private GDP productivity) • Macro – compared to ED+EL+HP: • real GDP growth reaches 7.9% (+0.7 %-age points • growth gains for domestic final demand 0.2-0.6 %-age points • Labor – compared to ED+EL+HP: strong wage gains (0.5-0.6 %-age points for all labor types) 2. Ethiopia application
3. Conclusions (1) • Main results: • Growth in female higher education accelerates GDP growth (esp. if financed by aid) and improves over-all welfare, including most MDG indicators; • Rates of female wage growth depend on growth in educated labor demand and the removal of discrimination against women in wage and employment decisions.
3. Conclusions (2) • Future work (drawing on emerging micro evidence): • incorporate links between incomes under female control and the allocation of spending across different types of consumption and savings; • add female education indicators to the determinants of health and education outcomes. • Such extensions make it possible to consider additional channels through which improved female education contributes to human development. 3. Conclusions