Download
1 / 10
100 likes | 222 Views
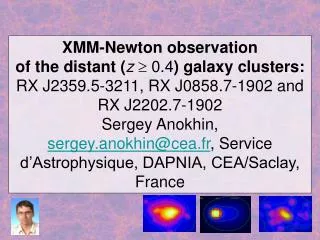
XMM-Newton observation of the distant ( z 0.4 ) galaxy clusters: RX J2359.5-3211, RX J0858.7-1902 and RX J2202.7-1902 Sergey Anokhin, sergey.anokhin@cea.fr , Service d’Astrophysique, DAPNIA, CEA/Saclay, France. Distant Clusters. 1. Introduction.

E N D
XMM-Newton observation of the distant (z 0.4) galaxy clusters: RX J2359.5-3211, RX J0858.7-1902 and RX J2202.7-1902Sergey Anokhin, sergey.anokhin@cea.fr, Service d’Astrophysique, DAPNIA, CEA/Saclay, France
1. Introduction Clusters of galaxies are a particularly rich source of information about the cosmological model, making possible a number of critical tests. Clusters are the largest and most recent gravitationally-relaxed objects to form because structure grows hierarchically. Models of cluster formation, taking into account only gravitation, predict that clusters constitutes a self-similar population. Scaling laws relate the various cluster properties to the temperature and redshift. In particular, the mass is expected to scale as Mh(z)-1T3/2 and the luminosity as Lxh(z)-1T2. It is known that cluster deviate from the self similar model. This is expected if non adiabatic processes play an important role in the evolution of the gas. These include radiative cooling (cooling flows in core) and possible non gravitational heating, by galactic winds (especially in cold clusters). The exceptional sensitivity of XMM, associated with good spectroscopic and imaging capabilities, now allows the detailed analysis of distant clusters and of the evolution of the scaling laws. We present here new XMM-Newton observations of 3 relatively cool clusters at z~0.4, complemented by archival observations of 3 others clusters. We derived the M–T and R-T relations from the hydrostatic equation using an isothermal temperature distribution. Also, we derived the Lx–T relation from spectral and brightness profile modeling.
R-T relation Whole cluster scaling Hot cluster scaling (T>3.5) (Arnaud et al. 2005) h(z) · Rδ, kpc δ=500 T, keV R-T realation Preliminary results
M-T relation Whole cluster scaling Hot cluster scaling (T>3.5) (Arnaud et al. 2005) h(z) · M(Rδ), M δ=500 T, keV M-T relation Preliminary results
L-T relation Lx-T relation Preliminary results h(z) · L(R500), 1044 ergs/s δ=500 T, keV
Scaling relations R-T and M-T relations: The study of R-T and M-T relations evolution described here used the local scaling relation of Arnaud et al. 2005. In that paper, the authors used a sample of ten nearby (z ≲ 0.15), relaxed galaxy clusters in the temperature range [2 − 9] keV, they investigated the scaling relation between the mass and the cluster temperature. The masses are derived from NFW-type model fits to mass profiles, obtained under the hydrostatic assumption using measurements, with XMM-Newton. Lx-T relation: We derived luminosity in order to check the consistency of our distant clusters with the Lx-T scaling study of Arnaud et Evrard (1999). In that paper, they derived the Lx-T relation using a nearly homogeneous data set of 24 clusters selected for statistically accurate temperature measurements and absence of strong cooling flows.
2. Data analysis We generated calibrated event files using the tasks emchain and epchain of the SAS V6.5. We discarded the data corresponding to the periods of high background induced by solar flares. We have made correction of vignetting effect with calibration data. To subtract the total XMM background, we used EPIC black field event files obtained by J. Nevalainen [6]. The background subtraction for each source product (spectrum or profile) is done in two steps. We first subtract the corresponding black field product, obtained using the same spatial or energy selection, and normalized by the factor defined by high energies band. In a second step, we thus subtract this local background component, using data in the outer part of the FOV, outside the cluster region. A β-model convolved with the XMM-Newton telescope PSF appropriate at the position of the cluster was then fit to these profiles, using simple χ2-minimization. Spectral fitting was implemented with the XSPEC v11 package (Arnaud 1996), using the MEKAL models (Mewe-Kaastra-Liedahl plasma emission model; Mewe et al. 1986) for a thermal spectrum, modified with interstellar absorption (McCammon & Sanders 1990). The uncertainty on the mass and contrast radiuses, deduced from the hydrostatic equation, is dominated by the uncertainty on the temperature and beta-model estimations, especially for cold clusters.
3. Results Analyses of XMM observations of RX J1120.1+4318, RX J1334.3+5030 and CL0016+16 has been published in the literature (Arnaud et al 2002, Lumb et al 2004 and Kotov & Vikhlinin 2005 respectively). The results presented here are consistent with these published results. All quantity are estimated within R500. The scaled R500, M500 and L500 are plotted in figures together with the local reference laws. The main results of our analysis can be summarized as follows: a. The R500 and M500 data are consistent with the expected evolution. b. The luminosity is consisted with expected evolution, excepted RXJ2202 .7-1902. This cluster can be in merging but this must to be confirm by further analysis.
References • Arnaud, M., Pointecouteau, E., and Pratt, G.W., A&A, 2005, 441, 893A. • Arnaud, M., Majerowicz, S., Lumb, D., Neumann, D. M., Aghanim, N., Blanchard, A., Boer, M., Burke, D., J., Collins, C. A., Giard, M., Nevalainen, J., Nichol, R. C., Romer, A. K., Sadat, R., 2002, A&A, 390, 27A • Voit G.M., Rev. Mod. Phys., AdSpR, 2005, 36, 701V, astro-ph/0410173 • Bryan, G. L., Norman, M.L., ApJ, 1998, 495, 80B • O. Kotov, O., Vikhlinin, A., ApJ, 2005, 633:781–790 • Nevalainen, J., Markevitch, M., Lumb, D., 2005, ApJ., 629, 172N • Arnaud, K. 1996, in Astronomical Data Analysis Software and Systems V, ed. G. Jacoby, & J. Barnes, ASP Conf. Ser., 101, 17 • Mewe, R., Lemen, J. R., & van den Oord, G. H. J. 1986, A&AS, 62, 197 • McCammon, D., & Sanders, D. T. 1990, ARA&A, 28, 657 • Arnaud, M., Evrard, A.E., MNRAS, 1999, 305, 631A