Understanding Global Population Dynamics: Growth Trends and Challenges
This overview explores the critical factors influencing global population dynamics, emphasizing the unprecedented growth in recent history, particularly in less developed countries (LDCs). With a world population exceeding 6.5 billion and life expectancy rising, we examine the implications of demographic changes, urbanization, and fertility rates. Highlighting the dependence of population density on agricultural viability and migration, we also analyze factors affecting natural increase rates (NIR) and the socioeconomic variables influencing them. Understanding these dynamics is essential for addressing future challenges.


Understanding Global Population Dynamics: Growth Trends and Challenges
E N D
Presentation Transcript
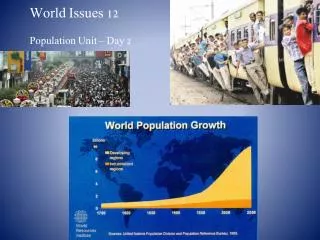
Population Intro • Why important to study? • More people on earth than at any other time in history (6.5 bill) • World’s pop increased faster in second half of 20th C than ever before • Almost all global pop growth is occurring in LDCs…poorest countries growing fastest…in some cases leads to famine and human suffering • People are living longer – past 50 yrs global life expectancy has increased by 20 yrs
DEMOGRAPHY • Demography: study of human pop • Most demographers agree world pop growth is slowing • Project pop will plateau at @ 12 bill some time in 21st C • Historically pop growth has been steady but certain events have checked it…..disease has been and continues to be biggest threat
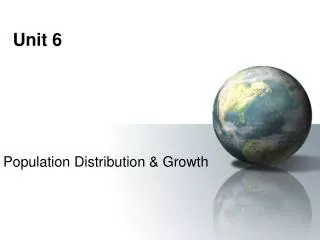
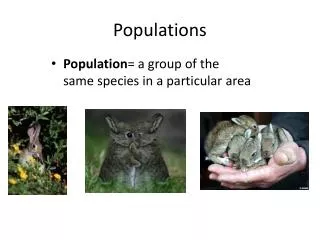
2.1 Population Concentrations • Ecumene: portion of earth’s surface occupied by permanent human settlement • ¾ world pop live on 5% of earth’s surface….Why? • 2/3 of world pop lives in 4 regions • 1.) EAST ASIA (E. China, Japan, Taiwan, Koreas • China has 20 large urban areas, but 2/3 pop is rural • China = world #1 • ¾ Japan and Korea = urban
4 Populous Regions - contd • 2.) SOUTH ASIA (India, Pakistan, Bangladesh, Sri Lanka) • India = world #2 • ¾ rural • 3.) EUROPE – E and W…mostly urban • 4.) SE Asia (islands of Java, Sumatra, Borneo, Papua New Guinea, Philippines, Vietnam, Thailand) • Indonesia = world #4 • Mostly rural
Top 10 Populous Nations • 1. China 6. Pakistan • 2. India 7. Russia • 3. U.S.A. 8. Bangladesh • 4. Indonesia 9. Nigeria • 5. Brazil 10. Japan • China and India expected to flip flop • U.S. will stay #3 b/c of immigration • LDCs taking top spots from MDCs
Population Density • Arithmetic Density: total # of people divided by total area of land • Can be misleading b/c is an average • US = 78/sq mile, but Manhattan is 67,000/sq mile and Loving, TX .1/sq mile • Highest = Bangladesh, Japan, Netherlands • Remember high pop (China) not necessarily high pop density
Pop Density cont’d • Physiological Density: ratio of people to a given unit of cultivable/arable land (suited for agriculture) • i.e. can you feed your population? • Can be high b/c of high pop density or poor land • Ex: US 404/sq mile of arable land Egypt 9,073/sq mile of arable land
2.2 POPULATION GROWTH • Rule of Thumb…. • Pop increases rapidly where many more born than die • Slowly where births barely exceed deaths • Decreases where deaths outnumber births • Increases when people move in and decreases when people move out
Pop Change…measured 3 ways • 1. Crude Birth Rate CBR: total # of births for every 1,000 alive • 2. Total Fertility Rate TFR: average # of children a woman will have during child bearing yrs. Affected by: culture, religion, lifestyle, is child econ asset or drain, access to birth control, mother’s educ and career
Pop Change – cont’d. • 3. Natural Increase Rate NIR: • NIR = CBR – CDR • Calculates % by which pop grows each yr. • Ex: CBR = 20, CDR = 5, NIR = 1.5% • Excludes migration – only natural increase • A negative NIR means pop decreasing • World NIR peaked in 1963 at 2.2% • World NIR has declined in last 20 yrs.
What determines a nation’s NIR? Factors to consider • Econ development • Education • Gender Empowerment – status and power to women • Health Care • Culture (i.e. Catholics or Mormons) • Public Policy (ex: China one child)
Factors determining a nation’s NIR – cont’d. • Conclusions….countries w/ low econ development, low educ, low gender empowerment, but w/ lower infant mortality rates b/c of improved health care, cultural traditions favoring fertility, and no public policy limiting pop growth..have HIGHEST rates
Where are these countries? • LDCs: sub Sahara Africa, parts of Middle East, parts of L. America • In MDCs pop growth is not natural but due to immigration • Irony – fastest growing places are least equip to deal w/ the growth
Doubling Time • Doubling Time: # of yrs needed for a pop to double • Formula 70/NIR…ex: NIR is 2.6 % DT is 70/2.6 = 27 years • Pop growth is compounded/exponential (if rate stays steady at 3% you’ll add more raw numbers each yr b/c base gets bigger) • At 3% rate, DT is less than 25 yrs. Taking place in SS Africa, parts of ME, and parts of Central America
MORTALITY • CDR • Infant Mortality Rate: annual # of deaths of infants under 1 yr compared w/ total # of births • In some parts of SS Africa is 10% • Life Expectancy: # or yrs a newborn can expect to live..75 in most MDCs, late 30s in some parts of Africa
Population Growth Curves • S Curve – historical growth • J Curve – exponential growth (fixed percentage)
Demographic Momentum • The tendency for pop growth to continue despite strict family planning b/c of young pop in child bearing yrs • Asia and LA 33% of pop under 15 • Africa 40% of pop under 15 • Ex: In 2002 both UK and S. Korea had fertility rate of 1.6. But projections for 2025, older UK will decline by 2 mill and youthful SK will add 2 mill.
2.3 Demographic Transition Model • 4 stage model shows similar process of pop change in all societies over time • Every country is at some stage • The model is irreversible…you do not go back
STAGE ONE: LOW GROWTH • Very high CBR and CDR cancel each other out • Almost no long term natural increase • Most of human history spent in stage one • No country is here today
STAGE TWO: HIGH GROWTH • Rapidly declining CDR but CBR remains high and = very high NIR • @ 1750 – late 1800s nations in Ind Rev (Eur and N. America) moved into stage 2. Improved agric and health care dropped CDR. • First time in world history to have significant growth • LDCs entered stage 2 @1950 when MDCs diffuse improved medical tech (vaccines) to LDCs. • Most of Africa in stage 2 today
STAGE THREE: MODERATE GROWTH • CBR rapidly declines and CDR continues to decline slowly. NIR begins to moderate • CBR drops b/c of social customs – access to birth control, infant mortality rate drops, women in work force, kids become econ drain • Eur and NA enter - first half of 20th C • Asia and parts of LA moved here in recent yrs
STAGE FOUR: LOW GROWTH • Very low CBR and CDR produce almost no long-term natural increase and possibly a decrease • Zero pop growth: CBR and CDR = • TFR of 2.1 produces zero growth • Most Euro countries in stage 4 today • Countries w/ negative NIR…Russia and Japan (shrinking)
Possible Stage Five? • In future if higher CDR than CBR you’ll have irreversible pop decline. • If a country stays in stage 5 without migration it will eventually cease to exist
Generalities of the Model • No one in stage 1; only a few have reached stage 4 • Model has 2 big breaks w/ the past • First break: sudden drop in death rate (stage 2) from technology and has taken place everywhere • Second break: sudden drop in birth rate (stage 3) comes from changing social customs and has not taken place everywhere
2.4 Population Structure and Composition • Population pyramids…show age and gender groups. How do MDC’s and LDC’s differ? • 1.) Sex Ratio: # of males per 100 females. In general slightly more males born, but women outlive men • Eur and NA 95 males: 100 females • World wide 102 males: 100 females
Pop Structure and Composition – cont’d. • 2.) Age Distribution • Dependency Ratio: # of people too old or young to work, compared to # of people in productive yrs. • % of pop under 15 = % over 65 divided by % in between 15-65 multiplied by 100 • Tells you how many dependents for every 100 workers • Stage 2 countries: ratio is 1:1 (1 worker for every dependent) Dependents are young • Stage 4 countries ratio is 2:1 (2 workers for every dependent) Dependents are young and old
Age Distribution – cont’d • Graying of the pop in MDCs – more than ¼ of all govn’t expenditures in US, Canada, Japan, and W. Eur goes to Social Security, health care, and other programs for the elderly • Baby Boomer Cohort in US (born 1946-1964)…what does this mean for you? • Generation X = 1965-1980
Population Structure and Composition – cont’d • Race and Ethnicity: Hispanics now largest minority in US (recently passed African Americans) • 11% of US pop is foreign born • 50% of that from LA • 50% of that from Mexico
Overpopulation and Sustainability • Should we worry @ overpopulation? • Thomas Malthus – 1798 wrote “Essay on the Principle of Pop” and argued • people need food to survive and have natural desire to reproduce • Food prod increases arithmetically and pop increases geometrically/exponentially • Predicted pop growth would eventually outpace people’s ability to produce food leading to starvation and famine
Neo Malthusians • Argue that 2 characteristics of recent pop growth make Malthus’ argument even more frightening • Esp high growth in LDCs • Pop growth outpacing econ dev in many LDCs (i.e. income rises 20% but pop rises 30%, so some LDCs worse off than they were 30 yrs ago) • Paul Erlich – most prominent neo-Malthusian. Wrote “Population Bomb” in 1968 – warned of mass starvation due to overpopulation http://overpopulationisamyth.com/overpopulation-the-making-of-a-myth
Critics of Malthus • Malthus did not account for ability of people to increase food prod dramatically w/ new technology (go to video 3) • Malthus did not foresee family planning and birth control and drop of CBR/NIR • Malthus did not recognize that famine is usually NOT related to a lack of food but to unequal dist of food – Marxist approach (Moderate approach) http://overpopulationisamyth.com/overpopulation-the-making-of-a-myth
Population and Sustainability • Carrying Capacity: # of people a given area can maintain…surpassed in densely populated places • Overpopulation implies a breach of an area’s carrying capacity. Also involves • Over consumption of resources • Inefficient allocation of goods • Unsustainable land use • MDC’s blame LDC’s – have too many babies • LDCs blame MDCs – consume disproportionate share of world’s resources
Control of Population • Pro-Natalist Policies – government policies to promote reproduction and bigger families • Ex. Tax breaks • Anti-Natalist – government and social policies that discourage reproduction to reduce pop growth rates • Tax breaks for sterilization • One-child policies – may lead to gender imbalance
Control of Population • Improve local and state economies • Better school, more eco opportunities • Reduce CBR through the use of contraception • Family planning programs in LDCs • Why is this sometimes difficult?
Epidemiological Transition Model • At times high CDR have lowered NIR • Stage 1: Pestilence and Famine: i.e. infectious diseases…ex: Black Plague 1350s kills ½ Eur pop • Stage 2: Receding Pandemics: improved sanitation, nutrition, medicine of Ind Rev decreases spread of infect diseases
Epidemiological Transition Model Cont’d • Stage 3: Degenerative and Human Created Diseases • Fewer deaths from infectious diseases • Increase in chronic disease associated w/ aging (heart disease and cancer) • Stage 4: Delayed Degenerative Diseases – degenerative diseases linger but life exp is extended trough medical advances (bypass, radiation, chemo, etc.)
Epidemiological Transition Model Cont’d • Possible Stage 5 – Reemergence of Infectious and Parasitic Diseases • Evolution of new strains of bacteria (TB, polio, malaria) • Poverty – people cannot afford drug treatment (TB) • Improved travel diffuses diseases faster (AIDS)