Population Density
Population Density. The number of organisms per unit area. United States or New York City?. Which has a higher population size? Which has a higher population density?. 3 Types of Dispersion. Fig. 4.2 Uniform Clumped Random. What type of dispersion….?. White-tailed deer? Black bear?

Population Density
E N D
Presentation Transcript
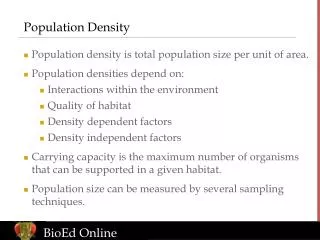
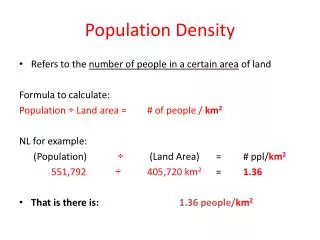
Population Density • The number of organisms per unit area
United States or New York City? • Which has a higher population size? • Which has a higher population density?
3 Types of Dispersion Fig. 4.2 • Uniform • Clumped • Random
What type of dispersion….? • White-tailed deer? • Black bear? • Bison? • Mountain lions? • Seeds dispersed by wind? • Caribou?
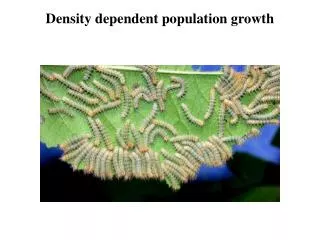
Density-dependent limiting factors a) Affect large, dense populations more than smaller, less- crowded populations • “Depends” on “density”
Density-dependent limiting factors • Predation: • Fig. 4.5 • Wolves & Moose on Isle Royale
Isle Royale • In addition to the predator/prey relationship, the moose and wolf population were affected by: • The amount of food for the mouse • Disease among the wolf population
Predator - Prey The “prey” always increases first.
Density-dependent limiting factors ii. Disease & Parasites: • Easily spread in large, dense populations
Density-dependent limiting factors iii. Competition: • Fig. 4.6 - Compete for available resources • Food, water, space
iv. Crowding & Stress: • The higher population density, the more crowding and stress on individual organisms
Density-independent factors • The density of the population DOES NOT MATTER • It doesn’t matter if the population is 5 or 5,000, they will be affected
Density-independent factors • Hot/Cold Weather • Fires • Floods/Hurricanes/Tornadoes • Human Activities – toxic waste spills, pesticides, deforestation
Population Growth Rate • How fast a population grows • It depends on 4 major factors
Population Growth Rate a) Natality = birthrate b) Mortality = death rate
Population Growth Rate c) Emigration – “exit” or leaving population d) Immigration – “in” or moving into a population
Population Growth Rate Population growth = • Natality – Mortality + Immigration - Emigration
If natality is 10, mortality is 6, immigration is 3, and emigration is 2…… • What is the net effect on the population size? • If the original population consisted of 10 individuals, what is the new population size?
Population Growth Rate • If birth rate > death rate • The population will….. • If birth rate < death rate • The population will….
Exponential Growth (J–shaped curve) • If ideal conditions (have everything!) continue, the population will continue to grow rapidly • Doubling and re-doubling • 1, 2, 3, 8, 16, 32, 64, 128…….. • Does NOT last long in nature – WHY?
Exponential Growth (J–shaped curve) d) This is current human population growth worldwide • How long can it last? • Discuss e) Draw graph *Industrial revolution
Boom and Bust • As ideal conditions continue, population grows exponentially until it reaches a “peak” size (boom) and then crashes (bust) • Ex: Rabbit population • Draw graphs
Logistic Growth (S-shaped curve) a) Exponential growth at first, eventually the population size levels off as the growth rate slows down b) Carrying capacity: Largest number of individuals that the environment can support
Logistic Growth (S-shaped curve) • Draw graph • Things that prevent the population from getting too big: • Lack of food or water • Home/shelter availability
Reproductive Patterns • r-strategy: rate strategy • Generally are small • Short life spans • Produce many offspring • rat, fruit fly, locusts (Fig. 4.9)
Reproductive Patterns • k-strategy: carrying capacity strategy • Larger organisms, long life span • Produces few offspring –better chance of survival • Take care of the offspring, usually for a long time • Kangaroo, elephant
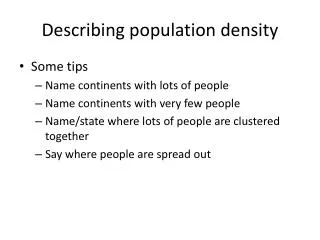
Demography • The study of human population size, density, distribution, movement, and birth and death rates
Demographic Transition • A change in a population from high birth and death rates to low birth and death rates • (Read pg 102)
Demographic Transition • Stage 1: birth rate & death rate • Stage 2: birth rate & death rate • Stage 3: birth rate & death rate • Stage 4: birth rate & death rate • Discuss & answer questions on Notes handout
Zero Population Growth • Birth rate = Death rate
Age-Structure Diagram • # of males & females in 3 age groups: • Pre-reproductive stage • Reproductive stage • Post-reproductive stage
Age-Structure Diagrams • Fig. 4.14 – predict future population sizes… • Pyramid shaped (pre-reproductive larger) • Smaller at the bottom (pre-reproductive #’s smaller)
Education & Demographic Transition • What does the first graph tell us? • What does the second graph tell us? • What is a key factor in reducing the overall worldwide population growth?