Download
1 / 3
30 likes | 236 Views
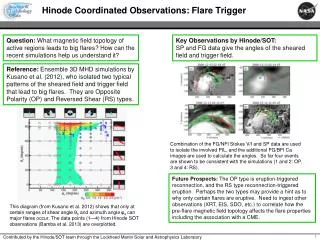
Hinode Coordinated Observations: Flare Trigger. Question: What magnetic field topology of active regions leads to big flares? How can the recent simulations help us understand it?. Key Observations by Hinode/SOT: SP and FG data give the angles of the sheared field and trigger field.

E N D
Hinode Coordinated Observations: Flare Trigger Question: What magnetic field topology of active regions leads to big flares? How can the recent simulations help us understand it? Key Observations by Hinode/SOT: SP and FG data give the angles of the sheared field and trigger field. Reference: Ensemble 3D MHD simulations by Kusano et al. (2012), who isolated two typical patterns of the sheared field and trigger field that lead to big flares. They are Opposite Polarity (OP) and Reversed Shear (RS) types. Combination of the FG/NFI Stokes V/I and SP data are used to isolate the involved PIL, and the additional FG/BFI Ca images are used to calculate the angles. So far four events are shown to be consistent with the simulations (1 and 2: OP, 3 and 4: RS). Future Prospects: The OP type is eruption-triggered reconnection, and the RS type reconnection-triggered eruption. Perhaps the two types may provide a hint as to why only certain flares are eruptive. Need to ingest other observations (XRT, EIS, SDO, etc.) to correlate how the pre-flare magnetic field topology affects the flare properties including the association with a CME. This diagram (from Kusano et al. 2012) shows that only at certain ranges of shear angle θ0 and azimuth angle φecan major flares occur. The data points (1—4) from Hinode SOT observations (Bamba et al. 2013) are overplotted. Contributed by the Hinode/SOT team through the Lockheed Martin Solar and Astrophysics Laboratory
Hinode Coordinated Observations: Coronal Waves/Dimming The redshift was interpreted as a strong downward push by MHD waves. Based on a statistical study of EUV waves by SDO/AIA (Nitta et al. 2013), this one was not a particularly strong event. For example, there was no associated Moreton-Ramsey wave. Question: When and where does the EUV wave form, presumably representing a fast-mode MHD wave? Do we have better visibility in solar minimum conditions? How is it related with the CME as represented by dimming? Challenges: Instruments with small and limited fields of view have slim chances to observe these global phenomena. We are searching for more examples of EIS observations of EUV waves, likely made accidentally. It would be nice if other instruments observed the same events. One marginal example is the 2007-12-07 event during the solar minimum (and before SDO). Best Hinode example so far: 2011-02-16 14:20 M1.6 flare in AR 11158 (Veronig et al. 2011, Harra et al. 2011). The EUV wave was observed by EIT and EUVI on STEREO. Despite a better cadence (2.5 min) of the 171 A channel than that of EIT, the front was rather slow, less than 300 km s-1. The fields-of-view are indicated on an EIT snapshot. Pink:XRT, Blue: FG Ca, Red: EIS. Clear redshift recorded at the wave fronts, followed by blueshift from dimming areas. For the 2011-02-16 event, the EIS slit was largely overlapped with the trajectory of the wave. Contributed by the Hinode/SOT team through the Lockheed Martin Solar and Astrophysics Laboratory
Hinode Coordinated Observations: Coronal Waves/Dimming Partly because of the slit position, the EIS spectra do not clearly reveal the Doppler velocities associated with the wave and dimming. The only possibly related features are in the first few minutes. The 2007-12-07 event: The region, AR 10977, was a nice sigmoid-shaped region, which may have to do with cancellation of the underlying magnetic field (Green et al. 2011). By the time of the flare accompanying a CME and EUV wave occurred, the region was spotless. It is generally harder to find a coronal wave in soft X-rays than in EUV. Historically, soft X-ray waves were detected in only a handful of strong eruptions (Hudson et al. 2003, Warmuth et al. 2005). The 2007-12-07 coronal wave appears to be detected in XRT difference images (marked below in cyan). The X-ray front matches the EUV front. This was only a B1.4 flare, and XRT’s AEC did not kick in for a while. SOT/FG Ca images show a nice spreading two-ribbon flare. Processed running-ratio images reveal a short-lived pattern, which is around the time of a type II radio burst. We have not reached firm results, but this event is certainly worth further study because of its eruptive character in spite of a minor X-ray flux. Contributed by the Hinode/SOT team through the Lockheed Martin Solar and Astrophysics Laboratory