1 / 3
30 likes | 51 Views
Get this template plus 350 other premium business tools & templates at www.demandmetric.com

E N D
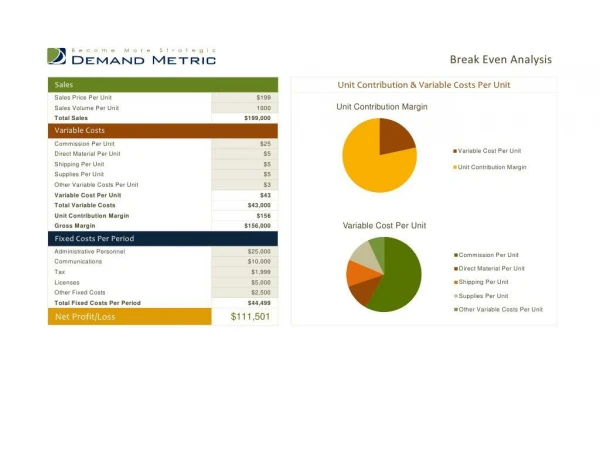
Break Even Analysis Tool Break Even AnalysisSales Unit Contribution & Variable Costs Per UnitSales Price Per Unit $199Sales Volume Per Unit 1000 Unit Contribution MarginTotal Sales $199,000Variable CostsCommission Per Unit $25Direct Material Per Unit $5 Variable Cost Per UnitShipping Per Unit $5 Unit Contribution MarginSupplies Per Unit $5Other Variable Costs Per Unit $3Variable Cost Per Unit $43Total Variable Costs $43,000Unit Contribution Margin $156Gross Margin $156,000 Variable Cost Per UnitFixed Costs Per PeriodAdministrative Personnel $25,000 Commission Per UnitCommunications $10,000 Direct Material Per UnitTax $1,999Licenses $5,000 Shipping Per UnitOther Fixed Costs $2,500 Supplies Per UnitTotal Fixed Costs Per Period $44,499 Other Variable Costs Per UnitNet Profit/Loss $111,501
Break Even AnalysisEnter estimated sales per period (units) in top row of calculator to determine your profitability based on sales volume. Break Even Point (Units) 285 Sales Volume Analysis Sales volume per period (units) 0 100 200 300 400 500 600 700 800 900 1000 Sales price per unit $199 $199 $199 $199 $199 $199 $199 $199 $199 $199 $199 Variable costs $0 $4,300 $8,600 $12,900 $17,200 $21,500 $25,800 $30,100 $34,400 $38,700 $43,000 Fixed Costs Per Period $44,499 $44,499 $44,499 $44,499 $44,499 $44,499 $44,499 $44,499 $44,499 $44,499 $44,499 Total costs $44,499 $48,799 $53,099 $57,399 $61,699 $65,999 $70,299 $74,599 $78,899 $83,199 $87,499 Total sales $0 $19,900 $39,800 $59,700 $79,600 $99,500 $119,400 $139,300 $159,200 $179,100 $199,000 Net profit (loss) -$44,499 -$28,899 -$13,299 $2,301 $17,901 $33,501 $49,101 $64,701 $80,301 $95,901 $111,501 Break Even AnalysisEnter estimated sales per period (units) in top row of calculator to determine your profitability based on sales volume. Break Even Point (Units) 285 Sales Volume Analysis Sales volume per period (units) 0 100 200 300 400 500 600 700 800 900 1000 Sales price per unit $199 $199 $199 $199 $199 $199 $199 $199 $199 $199 $199 Variable costs $0 $4,300 $8,600 $12,900 $17,200 $21,500 $25,800 $30,100 $34,400 $38,700 $43,000 Fixed Costs Per Period $44,499 $44,499 $44,499 $44,499 $44,499 $44,499 $44,499 $44,499 $44,499 $44,499 $44,499 Total costs $44,499 $48,799 $53,099 $57,399 $61,699 $65,999 $70,299 $74,599 $78,899 $83,199 $87,499 Total sales $0 $19,900 $39,800 $59,700 $79,600 $99,500 $119,400 $139,300 $159,200 $179,100 $199,000 Net profit (loss) -$44,499 -$28,899 -$13,299 $2,301 $17,901 $33,501 $49,101 $64,701 $80,301 $95,901 $111,501
$250,000 $199,000$200,000 $179,100 $159,200$150,000 $139,300 $119,400 $111,501 $99,500 $95,901$100,000 $79,600 $80,301 $59,700 $64,701 $49,101 $50,000 $39,800 $33,501 $19,900 $17,901 $0 $2,301 $0 -$13,299 0 100 -$28,899 200 300 400 500 600 700 800 900 1000 -$44,499 -$50,000 Unit Sales Fixed Costs Per Period Total costs Total sales Net profit (loss)-$100,000 $250,000 $199,000$200,000 $179,100 $159,200$150,000 $139,300 $119,400 $111,501 $99,500 $95,901$100,000 $79,600 $80,301 $59,700 $64,701 $49,101 $50,000 $39,800 $33,501 $19,900 $17,901 $0 $2,301 $0 -$13,299 0 100 -$28,899 200 300 400 500 600 700 800 900 1000 -$44,499 -$50,000 Unit Sales Fixed Costs Per Period Total costs Total sales Net profit (loss)-$100,000


