BREAK EVEN ANALYSIS
BREAK EVEN ANALYSIS. Importance of Planning and Control. Businesses must cover costs or they will make a loss Some new businesses will aim to only cover costs or break-even (ie not make a loss) in the first few years - to get established Profit is the amount made after costs are paid.


BREAK EVEN ANALYSIS
E N D
Presentation Transcript
Importance of Planning and Control • Businesses must cover costs or they will make a loss • Some new businesses will aim to only cover costs or break-even (ie not make a loss) in the first few years - to get established • Profit is the amount made after costs are paid. • Forecasting income and costs allows businesses to make decisions and plans eg – get a loan or overdraft in a month where income is low.
COSTS • Before going any further we need to know what the different types of costs are: • All business incur costs - and management accountants are charged with controlling and tracking these costs.
FIXED COSTS • These costs do not change as output changes. • Eg rent is always £3,000 pa - the landlord does not increase or decrease the amount depending on how much is being produced.
FIXED COSTS • OTHER EXAMPLES OF FIXED COSTS ARE: • Administration costs • Insurance • Rates • Heating and lighting • Salaries
VARIABLE COSTS • These costs do change in line with output. As more is produced these costs will increase. • Eg raw materials, labour costs, power costs
REVENUE • Revenue is the total amount made by selling the product or service
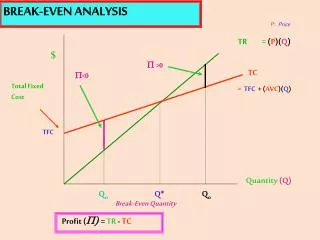
BREAK EVEN POINT Break-even is where the total costs and revenue are equal.
DISPLAYING THIS INFORMATION • The table looks very busy and for a non-specialist would be off-putting. • The best way to present the information is in the form of a chart.
Break-even Chart Sales Revenue Break-even point Total Costs Costs & Revenues (£) Fixed Costs Quantity G/C
The area to the left of BEP shows the losses made at the appropriate levels of sales since Total Cost is greater the Sales Revenue. The area to the right of BEP shows the profits made at the appropriate levels of sales since Sales Revenue is greater the Total Cost. Therefore the BE chart allows you to calculate whether a profit or loss will be made at any level of sales. G/C
Interpreting the chart • Up until break-even point the company is making a loss • After break-even point the company is making a profit
Rent Chocolate Staff wages Packaging Icing sugar Coffee Electricity Ribbons Flour Advertising material Insurance Lolly sticks Ice cream Tea Milk Website designer Chocolate Factory Costs - Fixed or Variable?
QUESTIONS • What are fixed costs? • What are variable costs? • How would you calculate Total costs? • What is meant by revenue? • How much profit is made at Break-even point?