BREAK EVEN ANALYSIS
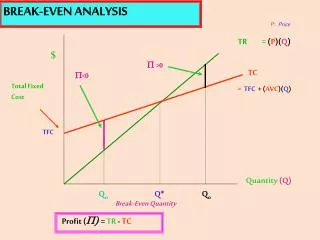
BREAK EVEN ANALYSIS. Break Even Analysis is a method for identification the relationship between costs and volume of output and profit.The point where the sales, revenue equals total cost and there is neither profit nor loss . WHY B.E.P. IS CALCULATED ?


BREAK EVEN ANALYSIS
E N D
Presentation Transcript
BREAK EVEN ANALYSIS Break Even Analysis is a method for identification the relationship between costs and volume of output and profit.The point where the sales, revenue equals total cost and there is neither profit nor loss. WHY B.E.P. IS CALCULATED ? A term loan should be serviced out of profits. If the unit functions at a sales level at which there is no profit, it is natural that it cannot repay the term loan instalments. This brings the necessity for calculating the level of sales above which profits are earned by the unit.
CLASSIFICATION OF COSTS: Fixed Costs 1.Wages of permanent labour 2.Salaries of administrative staff 3.Rent 4.Taxes 5.Insurance 6. Interest on term loans 7.Maintenance expenses 8. Travelling expenses/ conveyance 9.Postage and Stationery 10. Telephone expenses 11. Depreciation etc.
CLASSIFICATION OF COSTS Contd… Variable Costs 1.Raw Material 2. Consumables 3.Power and Fuel 4. Inward Carriage 5.Packing material 6. Interest on working Capital 7.Direct Labour etc These are also called as “Marginal Costs” Semi-variable costs Semi variable costs are hybrid costs made up of fixed element and a variable element. 3
TECHNQUE: • OPTIMUM CAPACITY : Choose the year of optimum capacity utilisation. • CLASSIFICATION OF COSTS: Classify costs into variable & fixed costs • CONTRIBUTIN Contribution per unit of product = Sales Price per unit – Variable costs per unit • CALLCULATION OF BEP Fixed Cost BEP in units = ------------- Contribution per unit BEP in Rupee = BEP in units x SP per unit or Fixed cost x Total sales in Rs. = ----------------------------------Total contribution 4
TECHNQUE: Contd…. BEP IN CAPACITY = (F.C. X Projected Capacity Utilisation at Optimum Level) = --------------------------------------------------------------- Total Contribution CASH BEP It is the point of sale at which the unit does not incur cash loss or generate cash profit. 5
MARGIN OF SAFETY (MOS) The difference between actual or budgeted sales and break-even sale is known as margin of safety. USES: • To study the viability of the project • To decide optimum product mix • To decide the required level of production in order to attend a desired level of profit Note: a) We can workout Margin of Safety by the Following method: Margin of safety = Sales level (Rs)- Break even level of sales (Rs) x 100 Sales Level (Rs) This is expressed as a percentage 6
MARGIN OF SAFETY (MOS) Contd… b) The unit earns profits only if It is able to work above its BEP c) The BEP is dependent on the variable expenses It is desirable that the BEP or BE level of sales is estimated at periodic intervals to ensure that the unit is always operating above Break Even Point. d) The repayment of the term loan, if any will be out of the surplus generated e) Break Even Analysis (Marginal Costing) is a very powerful tool in taking various management decisions such as capital investment decisions , make or buy decisions, pricing etc. 7