
Uploaded by
asa
0 SLIDES
759 VIEWS
70LIKES
Break-even Analysis
DESCRIPTION
Break-even Analysis. Use quantitative & graphical methods to calculate break-even quantity. Define & interpret the margin of safety. . What is Break-even?. Total Costs = Total Revenue Measure of quantity How many units need to be sold in order to cover all product costs?
Download

1 / 0
Download Presentation 
Break-even Analysis
An Image/Link below is provided (as is) to download presentation
Download Policy: Content on the Website is provided to you AS IS for your information and personal use and may not be sold / licensed / shared on other websites without getting consent from its author.
Content is provided to you AS IS for your information and personal use only.
Download presentation by click this link.
While downloading, if for some reason you are not able to download a presentation, the publisher may have deleted the file from their server.
During download, if you can't get a presentation, the file might be deleted by the publisher.
E N D
Presentation Transcript
-
Break-even Analysis
Use quantitative & graphical methods to calculate break-even quantity. Define & interpret the margin of safety. - What is Break-even? Total Costs = Total Revenue Measure of quantity How many units need to be sold in order to cover all product costs? Key objective for new businesses Important for monitoring “product” cash-flow Money coming in (revenue) Money going out (costs)
- 5/7 Warm –up Explain the concept of Contribution Define and explain how is it calculated Describe how a business can improve its contribution.
- Contribution Revenueremaining after deducting direct/variable costs Amount “contributed” towards paying indirect & fixed costs Per Unit Contribution (Contribution_Margin) Average Revenue Average Variable Cost (Contribution_Margin * Units Sold) Total Contribution Total Fixed Costs Total Profit
- Strategies toIncrease Profitability? Increase Contribution Increase in Profitability Increase Average Revenue Decrease Average Variable Cost Per Unit Contribution (Contribution_Margin) Average Revenue Average Variable Cost Total Contribution Total Fixed Costs Total Profit
- Purpose of Break-even Analysis To inform management Is it worthwhile to produce a good or service? How much profit will we earn if things go as planned?
- Determining Break-even(1) Formula Jeans Retailer Fixed Costs = $2,500 per month Average Selling Price = $30 Variable Costs = $10 Total Fixed Costs Total Variable Costs Total Revenue
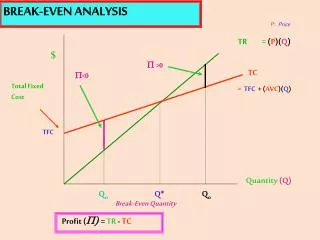
- Determining Break-even(2) Interpret Chart Costs & Revenue ($) Jeans Retailer Fixed Costs = $2,500 per month Average Selling Price = $30 Variable Costs = $10 Total Revenue Total Costs 3750 2,500 Total Fixed Costs 125 Output/Sales (jeans/month)
- Margin of SafetyQuantifying Level of Risk Forecasted Demand Quantity – Break-even Quantity Large positive difference less risk (“safer”) Small positive difference riskier (“closer” to losing money) Negative losing money
- Constructing Break-even Chart Calculate the break-even quantity (beq) Calculate the value ($) of total costs & revenue at break-even quantity TotalCostsbeq = (beq * AvgVarCost) + FixedCost TotalRevenuebeq= beq * AvgRevenue Label the x- & y- axis Draw & label the Total Fixed Cost (TFC) line Draw & Label the Total Cost (TC) line Crosses vertical axis at same level as TFC Draw & Label the Total Revenue (TR) line Begins at the origin
- Break-even Analysis & Decisions Evaluate new products Assess level of risk involved for a project Make or buy Cost structures are different Special Order Decisions Assess profitability of customer requests
- Break-even Calculate the total costs per month for the business. Calculate the firm’s profit for the month. Calculate the average cost of production at; 100 units 200 units Calculate the break-even quantity Wallets-R-Us Ltd. Has fixed overheads of $500 and sells 200 units per month. Each item sells for $35 and has direct/variable costs of $15.
- Break-even Calculate the firm’s current average costs each month. Calculate the firm’s break-even. Calculate the firm’s margin of safety. McMahon Candies has monthly fixed costs of $3,000 and unit variable costs of $2. Its current level of demand is 3,000 units each month. The average unit selling price is $6.
- Break-even Calculate the average selling price. Calculate the average variable cost per unit. Calculate the break-even level of output Calculate the margin of safety if 600 units per month are sold. Draw a break-even chart for Smash Racquets. Co. Smash Racquets Co. makes a profit of $10,000 on sales revenue of $50,000. Its fixed costs are $5,000 and sales volume is 1,000 units per month.
- Textbook Problem 5.3.3 pg 647


More Related