Download
1 / 92
920 likes | 943 Views
This report analyzes frequency rate changes in ERCOT grid, including highest and lowest inertia events in 2010, with detailed examples and data.

E N D
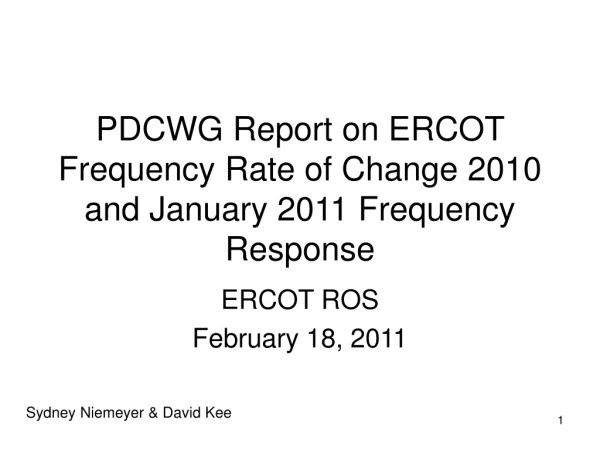
PDCWG Report on ERCOT Frequency Rate of Change 2010 and January 2011 Frequency Response ERCOT ROS February 18, 2011 Sydney Niemeyer & David Kee
Report Contents • 2010 Frequency Event’s Rate of Change in Frequency and Grid Inertia. • Slide 3 through 78. • January 2011 Frequency Response Performance during five events. • Slide 79 through 92.
Highest Rate of Change in Frequency • Using high speed frequency data, the rolling one second change in frequency is calculated. • From the most negative rate of change in frequency (highest change in frequency within any one second period) during the initial frequency decline, the frequency change per MW of imbalance is calculated. • Hz per second per MW lost. • Example: -0.067 Hz/second maximum rate of change of frequency during the trip of a 585 MW generator. • -0.067/585 MW = -0.000115 Hz/second/MW lost. (115 µHz/sec/MW) • A more negative number between different events indicates lower Grid Inertia.
Lowest Inertia Events in 2010 • Oct 31, 2010 @ 00:11:02 -145 µHz/sec/MW. • Dec 19, 2010 @ 02:39:27 -142 µHz/sec/MW. • Feb 27, 2010 @ 22:55:04 -138 µHz/sec/MW. • Mar 25, 2010 @ 00:11:42 -136 µHz/sec/MW. • Sep 19, 2010 @ 06:59:52 -127 µHz/sec/MW. • Apr 7, 2010 @ 00:33:50 -126 µHz/sec/MW. • Nov 7, 2010 @ 01:57:54 -126 µHz/sec/MW.
-115 µHz/sec/MW Highest rate of change in any one second period during the frequency reset. Between Point C and Point B. Highest rate of change in any one second period during the frequency decline.
Next set of Slides • Each 2010 event with frequency rate of change. (Slide 13 through 80) • Close up look at Nov 3rd LaaR tripping and frequency rate of change. (Slide 63) • Summary (Slide 77)