Frequency Response Methods
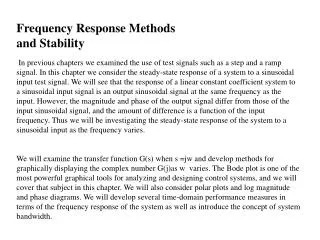
Frequency Response Methods. The system is described in terms of its response to one form of basic signals – sinusoid. The reasons of using frequency domain techniques for the analysis & design of system are as follows:


Frequency Response Methods
E N D
Presentation Transcript
Frequency Response Methods • The system is described in terms of its response to one form of basic signals – sinusoid. • The reasons of using frequency domain techniques for the analysis & design of system are as follows: • The use of the sinusoid as a basic signal is not as restrictive as first appears. By use of Fourier method it is possible to construct a range of signals by linear combinations of sinusoids. • The mathematical methods used in the frequency domain are simpler to apply that the corresponding time domain methods. In particular, differential equations are replaced by algebraic equations (with the variable as a complex quantity)
Reasons for using frequency domain techniques (continues) • Response in the time domain can be obtained from frequency domain results. If some degree of approximation is allowable this can be done by use of simple graphical methods. • For many applications, design in the frequency domain is conceptually easier and gives a greater physical insight into the system. • Sophisticated equipment exists for measuring frequency responses and thus enabling a frequency domain model to be obtained from practical measurement
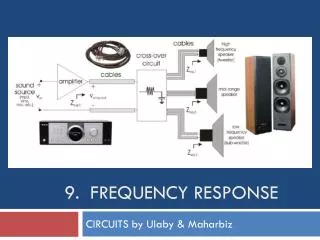
Response of a continuous System to a sinusoidal input • Consider right block diagram x(t) is applied to a LTI system at time t=0
General plot for a first order system • A first order system has a frequency response function like
General plot for a first order system • General features of the first order response: • The magnitude plot starts at K ( The system gain factor) at w=0 and fall to zero as w-> infinite • The magnitude of the gain has fallen by a factor ½ form its low frequency gain when w = 1/T • The phase plot start to 0 when w=0 and approach -90 degree (legging) as w-> infinite • The phase shift is -45 degree when w=1/T