Visual Data Analysis
Visual Data Analysis. By: Anna Samouris, Tyerell Warren, LaVonda Suggs & Ashley Turner. What is Visual Data Analysis?.

Visual Data Analysis
E N D
Presentation Transcript
Visual Data Analysis By: Anna Samouris, Tyerell Warren, LaVonda Suggs & Ashley Turner
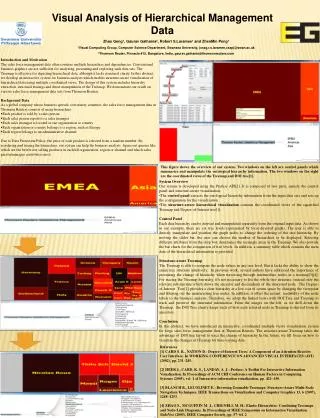
What is Visual Data Analysis? • Visual data analysis blends highly advanced computational methods with sophisticated graphics engines to tap the extraordinary ability of humans to see patterns and structure in even the most complex visual presentations.
Visual Data Analysis Overview • Data collection, storage, transmission, and display has changed dramatically over the past ten years. • Scholars have undergone a profound transformation in the way they approach data-related tasks. • Data collection and compilation is no longer the tedious, manual process it once was. • Tools to analyze, interpret, and display data are increasingly sophisticated, and their use routine in many disciplines.
Visual Data Analysis Overview Cont. • A variety of tools are emerging that make it possible for almost anyone with an analytical bent to easily interpret all sorts of data. • Self-organizing maps are an approach that mimics the way our brains organize multi-faceted relationships. • Cluster analysis is a set of mathematical techniques for partitioning a series of data objects into a smaller amount of groups, or clusters, so that the data objects within one cluster are more similar to each other than to those in other clusters. • Visual, interactive principal components analysis is a technique once only available to statisticians that is now commonly used to identify hidden trends and data correlations in multidimensional data sets.
Visual Data Analysis Overview Cont. • These sorts of tools are now finding their way into common use in many other disciplines, where the analytical needs are not necessarily computational; visualization techniques have even begun to emerge for textual analysis and basic observation. • Many are free or very inexpensive, bringing the ability to engage in rich visual interpretation to virtually anyone. • Online services such as Many Eyes, Wordle, Flowing Data, and Gapminderaccept uploaded data and allow the user to configure the output to varying degrees.
Relevance for Teaching, Learning, or Creative Inquiry • Models of complex processes in quantum physics, organic chemistry, medicine, or economics are just a few of the ways in which the outcomes of visual data analysis can be applied to learning situations.
Relevance for Teaching, Learning, or Creative Inquiry Cont. • Visual data analysis may help expand our understanding of learning itself. • Learning is one of the most complex of social processes, with a myriad of variables interacting in highly complex ways, making it an ideal focus for the search for patterns.
Looking Back on Visual Data Analysis • Undoubtedly, Visual Data Analysis is beneficial to the teacher and the learner. However, the complexity of Visual Data Analysis should be made appropriate for the age group in which it is presented to.