Download
1 / 1
10 likes | 170 Views
Visual Analysis of Hierarchical Management Data. Zhao Geng 1 , Gaurav Gathania 2 , Robert S.Laramee 1 and ZhenMin Peng 1 1 Visual Computing Group, Computer Science Department, Swansea University, {cszg,r.s.laramee,cszp}@swan.ac.uk

E N D
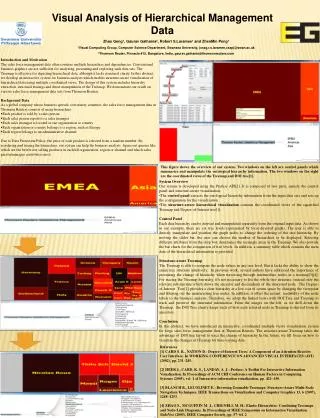
Visual Analysis of Hierarchical Management Data Zhao Geng1, Gaurav Gathania2, Robert S.Laramee1 and ZhenMin Peng1 1Visual Computing Group, Computer Science Department, Swansea University, {cszg,r.s.laramee,cszp}@swan.ac.uk 2Thomson Reuter, Pinnacle #15, Bangalore, India, gaurav.gathania@thomsonreuters.com • Introduction and Motivation • The sales force management data often contains multiple hierarchies and dependencies. Conventional business graphics are not sufficient for analyzing, presenting and exploring such data sets. The Treemap is effective for depicting hierarchical data, although it lacks structural clarity. In this abstract, we develop an interactive system for business analysts which enables structure-aware visualization of hierarchical data using multiple coordinated views. The design of this system includes hierarchy extraction, structural tracings and direct manipulation of the Treemap. We demonstrate our result on various sales force management data sets from Thomson Reuters. • Background Data • As a global company whose business spreads over ninety countries, the sales force management data in Thomson Reuters consists of many hierarchies: • Each product is sold by a sales person • Each sales person reports to a sales manager • Each sales manager is located at one organization or country • Each organization or country belongs to a region, such as Europe. • Each region belongs to an administrative channel. • Due to Data Protection Policy, the price of each product is selected from a random number. By reordering and tracing the hierarchies, out system can help the business analysts figure out queries like which are the best/worst selling products in each/all organization, region or channel and which sales person/manager contributes most. This figure shows the overview of our system. Two windows on the left are control panels which summarize and manipulate the ontological hierarchy information. The two windows on the right are the coordinated views of the Treemap and DOI tree[1]. • System Overview • Our system is developed using the Prefuse API[2]. It is composed of two parts, namely the control panel and structure-aware visualization: • The control panel extracts the ontological hierarchy information from the input data sets and sets up the configuration for the visualization • The structure-aware hierarchical visualization contains the coordinated views of the squarified Treemap and Degree-of-Interest tree[1]. • Control Panel • Each data hierarchy can be derived and manipulated separately from the original input data. As shown in our example, there are six tree levels represented by force-directed graphs. The user is able to directly manipulate and position the graph nodes to change the ordering of the tree hierarchy. By moving the slider bar, the user can choose the number of hierarchies to be displayed. Selecting different attributes from the drop box determines the rectangle areas in the Treemap. We also provide the bar charts for the comparison of tree levels. In addition, a summary table which contains the meta data of the hierarchical information is provided. • Structure-aware Treemap • The Treemap is able to compare the node values in any tree level. But it lacks the ability to show the entire tree structure intuitively. In previous work, several authors have addressed the importance of presenting the change of hierarchy when traversing through intermediate nodes in a treemap[3][4]. For tracing the Treemap hierarchy, it’s not necessary to list the whole tree structure, instead only the relevant substructure which shows the ancestor and descendants of the interested node. The Degree-of-Interest Tree[1] provides a clear hierarchy at a low cost of screen space by changing the viewpoint and filtering out the uninteresting tree nodes. In addition, it offers the instant readability of the node labels to the business analysts. Therefore, we adopt the linked views with DOI Tree and Treemap to track and preserve the structural information. From the images on the left, as we drill down the Treemap, the DOI Tree clearly keeps track of how each selected node in Treemap is derived from its ancestors. • Conclusion • In this abstract, we have introduced an interactive, coordinated multiple views visualization system for large sales force management data at Thomson Reuters. The structure-aware Treemap takes the advantage of DOI tree layout to trace the change of hierarchy In the future, we fill focus on how to visualize the changes of tTeemap for time-varying data. References [1] CARD S. K., NATION D.: Degree-of-Interest Trees: A Component of an Attention-Reactive User Interface. In WORKING CONFERENCE ON ADVANCED VISUAL INTERFACES (AVI) (2002), pp. 231–245. [2] HEER J., CARD, K. S., LANDAY, A. J.: Prefuse: A Toolkit For Interactive Information Visualization. In Proceedings of ACM CHI Conference on Human Factors in Computing Systems (2005), vol. 1 of Interactive information visualization, pp. 421–430. [3] BLANCH R., LECOLINET E.: Browsing Zoomable Treemaps: Structure-Aware Multi-Scale Navigation Techniques. IEEE Transactions on Visualization and Computer Graphics 13, 6 (2007), 1248–1253. [4] ZHAO S., MCGUFFIN M. J., CHIGNELL M. H.: Elastic Hierarchies: Combining Treemaps and Node-Link Diagrams. In Proceedings of IEEE Symposium on Information Visualization (InfoVis) (2005), IEEE Computer Society, pp. 57–64. 2