Download
1 / 58
580 likes | 695 Views
World Energy Scenarios: main issues and policy options. Alessandro Vercelli University of Siena Based upon:

E N D
World Energy Scenarios: main issues and policy options Alessandro Vercelli University of Siena Based upon: -Greenhouse gas emissions and the energy system: are current trends sustainable? (with S. Borghesi), International Journal of Global Energy Issues, Special issue on “Energy Efficiency, Environmental Performance and Sustainability”, 2009, vol.32, 1-2, pp.160-174.
Sustainable development and the energy system The existing energy system is a crucial obstacle to sustainability: A) SCARCITY: conventional fossil fuels Environmental { B) POLLUTION: concentration of greenhouse gases - inequality in per capita energy consumption Social { - poverty: 1.4 Bln without electricity in 2030 → trapped in poverty -security: concentration of reserves Economic{ -cost inflation: triggered the crisis → stagflation?
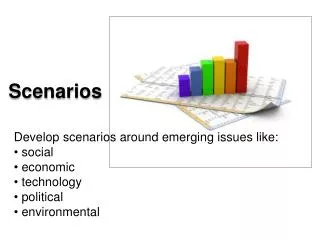
Structure of the presentation 2 parts: 1st Part: The current world energy scenario: two views The current scenario is reconstructed on the basis of the main energy series for the last 30 years. Their projections to the next 20-30 years are discussed. conventional (mainstream) interpretations based on 2 points of view { critical 2nd Part: Policy implications of energy scenarios Different interpretations of the current world energy scenario lead to different policy strategies that will be critically examined.
A) CONVENTIONAL POINT OF VIEW market Optimism{ market-led technological progress reserves of fossil fuels sufficient (1/2 c.) 1. No physical scarcity of energy{ the tank of earth spaceship is still full Sheik Yamani (OPEC) “stone age didn’t end because stones were exhausted and oil age will not end because the oil is exhausted” bronze and iron → better instruments { alternative energy sources
Conventional point of view (continues) local economic scarcity { temporary Price tensions are not excluded { → dealt with by the market → optimistic interpretation also of the recent upward jump of prices: -less than in the 1970s -temporary policy factors (IRAQ, IRAN, Russia) Recent increase { ↑ demand: South and East Asia, wars, etc. ↑ liquidity (Japan, Greenspan…)
Conventional point of view (continues) 2. market-led technological progress: is believed always to find timely solutions to the emerging problems - ↓ energy intensity: E/Y - prompt shift towards alternative energy sources as soon as structural shortages of fossil fuels will emerge
Energy intensity Fig. 2: energy intensity by region toe 1000$ GDP ($1995 PPP) source: IEA (2004)
Secular patterns of energy intensity Fig 4: energy intensity in selected countries source: Colombo (1992)
Energy intensity in China Taking account -of the secular pattern of energy intensity in the other countries -and of the stage of development reached by China (as represented by its per capita income) one could expect China to be still climbing the increasing part of the curve On the contrary, in the period 1980-2000 China managed to quadruple income doubling the consumption of energy so that the energy intensity was cut by half remarkable achievement that is planned to continue in the next 20 years energy efficiency is still low as compared to industrialised countries (60% of the world average and 1/5th of the OECD countries) However{ convergence is due to increase energy consumption and pollution at a rate much higher than that of income: e.g. E= E/P x P
Conventional point of view (continues) ↓ energy intensity 3. Pollution { ↓ carbon content: shift from carbon to oil to gas, shift from fossil fuels to non-fossil fuels, more efficient production and consumption → automatic stabilization based on market prices
Policy implications of the conventional view according to this view, in principle, there is no need of energy policies because the market and market-driven technological progress will always solve the emerging problems of course this presupposes a well-functioning competitive market: to reach this goal it is considered sufficient the privatization and liberalization of the energy market in a few industrialized countries (including EU) it is maintained that we need also policy measures meant to internalize the external costs of fossil fuels (through policy instruments such ascarbon tax, emission permits, etc.)comparing them with those of alternative energy options
Critique to the conventional point of view 1 The transition to a sustainable system is too slow:renewable sources are expected to grow very little Justification:the cost of production of KWH is still inferior in the case of fossil fuels, but this assertion is questionable; we should take account also of: - vulnerability -External costs of fossil fuels{ - health: 10.000 casualties only for coal - pollution → global warming -Economic and political risks: concentration in the Middle East -scale economies in fossil fuels sector -Distortions of market-led investment{ -infrastructures concerning fossil fuels -fall of energy investment since ’90s -Distortion of public incentives still concentrated on fossil fuels (in EU > 70%)
Critique to the conventional point of view 2 Powerful private interests slow down the transition to a sustainable model of production, distribution and consumption of energy: -OPEC and other producers -Multinational corporations -Superpowers who invested in the existing energy policies →want to exploit their assets: oil, natural gas, coal Inertia also in other countries: huge fiscal income that is difficult to substitute -centralized Renewable energy sources are not easily { -exploitable for profits
B) Critical point of view 1 The current model of production, distribution and consumption of energy is highly vulnerable: -physical scarcity of fossil fuels has to be taken very seriously and cannot be assessed separately from their economic scarcity (Hubbert curve) -territorial concentration of production of fossil fuels (2/3 oil reserves in the Middle East) -centralization of transport infrastructures (gas pipes, oil tankers) -oligopolistic market: limited number of very powerful multinational corporations
Critical point of view 2 1. The problem of scarcity of fossil fuels is not strictly physical but derives from the interaction of physical scarcity and economic constraints The data on “proven” reserves are inflated: multinationals (Shell: January 2004 ↓ 20%) “creative” geological accounting { ↑ production quotas producing countries { ↑ credit conditions peak theory (“peak oil”) has been introduced by the famous oil geologist Marion King Hubbert in 1956 in a paper presented at the American Petroleum Institute that introduced the Hubbert curve
Hubbert’s curveHubbert peak theory (“peak oil”) • Marion King Hubbert: geophysicist at the Shell laboratories in Houston In 1956, he presented an article “Nuclear Energy and Fossil Fuels” at a meeting of the American Petroleum Institute in San Antonio -1970: peak in the US • Forecasts { -2000: global peak • Bell-shaped curve: describes the annual production of oil as a function of time
Hubbert’s Peak • From the 1956 article • Hubbert drew the graph by hand and integrated the areas by counting the little squares • He opted for the higher estimate culminating in the 1970s
Physical scarcity: Hubbert curve bell-shaped curve that describes the production per year of oil in function of time -1970: peak of USA oil production forecasts in 1956 { -2000: peak of world oil production -actual peak in USA: 1971 actual outcomes { -not yet, however the oil shocks of the 1970s and the world recession of the 1980s have postponed the peak In any case the production of oil is already declining in 33 of the 48 biggest producing countries
Hubbert curve of discoveries of new reserves and of oil production source: Ivanhoe, 2005
Recent forecasts of Hubbert’s followers • Prof. Kenneth Deffeys, author of “Hubbert’s Peak” e “Beyond oil-the view from Hubbert Peak” maintains that the peak has been overcome on December 16 of 2005 • Prof. Colin Campbell founder of ASPO (Association for the Study of Peak Oil & Gas) maintained that the peak well be overcome before the 2010 • Also natural gas is close to the peak at the world level and beyond the peak in many countries: USA 2003, UK 2000, world 2010-2020 • 2004: world consumption 30 MLD of barrels; new reserves discovered: 8 MLD
Implicazioni del dibattito in corso (rapporto Hirsch, 2004) • Il picco non è lontano: ci vorranno al massimo 20 anni: -La produzione è in declino in 33 dei 48 più grandi paesi produttori -Picco delle scoperte superato nel 1962 -L’ultimo giacimento gigante è stato scoperto negli anni ’60 -La maggior parte delle previsioni del picco della produzione si collocano tra il 2010 e il 2020 • Avviare subito un programma sistematico di mitigazione per evitare che si crei una grave scarsità strutturale nei combustibili liquidi - sono necessari 20 anni di strategia preventiva per evitare la crisi -10 anni potrebbero bastare per evitare le conseguenze più nefaste ma non eviterebbe una crisi decennale dopo il picco -una mitigazione prematura avrebbe conseguenze negative modeste
After the peak ↑ demand • Shortage of oil:{ → increasing gap ↓supply situation different from the past: structural shortage for irreversible geological reasons not only for transient economic or political reasons • Serious risks: -strong and persistent cost inflation with heavy consequences on: transports, fertilizers, plastics, etc. -Reduction of purchasing power of families: ↓ life standards
Critiques to the Hubbert curve • Fallacy of composition: extension to the aggregate level of a pattern that is valid for each single oil field • Frequent revisions of peak forecasts: however what matters is whether we are approaching a peak • The world supply is not rigid: the increasing price of oil mobilizes new investment and makes convenient new productive processes: -deeper oil fields -tar sands -hydrocarbons trapped in polar ice -Syngas via liquefaction of coal (South Africa: 50%) -energy savings (as in the 1970s) -substitution with alternative energy sources (renewable energy, ethanol, nuclear, etc.)
Critical point of view 3 2.In the energy field the myth of the omnipotence of competitive markets is particularly questionable: the allocation of resources is controlled not by the “invisible hand” of the market but by quite visible hands (multinational companies, OPEC countries and most powerful industrialized countries) that act in their own private interest the current trends are inconsistent with sustainable development: the projections of current trends to the next 30 years show (IEA): - global energy demand is expected to grow at 1.7 % per year while the supply is not easily increased - according to some projections, fossil fuels are expected to increase their share in global supply and international trade (↑ dependence and insecurity)
Critical point of view 4 3. The technical progress has been channeled towards the reduction of cost of production and transport of fossil fuels -in 2001 73% of EU energy subsidies towards fossil fuels -R&D in the energy sector declined significantly since 1990 4. The global energy intensity is expected to decrease at a rate of 1.2 % but this is not enough to reduce CO2 emissions that will increase at the rate of 1.8% per year (IEA) These trends are inconsistent with sustainability: -1.4 MLD without electricity in 2030 → poverty and inequality social { -2/5 of population: traditional biomass that is polluting and inefficient -strong inequality in per capita energy consumption environmental: strong increase in the concentration of CO2
CO2 Emissions Fig 5: Total CO2 world emissions by income Source: elaborations from World Bank data (World Bank, 2004)
Situazione attuale(Stern Review, 2006; IPCC, 2007) Fatti principali: • Flusso annuo di GHGs: attuale 42 GtCO2-e massimo assorbimento da parte della biosfera 5 GtCO2-e • Stock (concentrazione nell’atmosfera) ↑ attuale 430 ppm (parti per milione) valore medio prima della rivoluzione industriale: 280 ppm sta aumentando al ritmo di 2.3 ppm all’anno → livello doppio di concentrazione entro pochi decenni →↑ 2 - 4,5°C (stima più attendibile 3°C) • Temperatura media globale ↑ 0,74 gradi Celsius negli ultimi cento anni → ↑ 2 – 4 °C best estimates prima della fine del secolo (Stern) • Causa fondamentale emissioni antropogeniche di GHGs (IPCC: p > 90%) (il contributo delle variazioni nell’intensità delle radiazioni solari: < 1/12°)
CONSEGUENZE DEL RISCALDAMENTO GLOBALE • Scioglimento dei ghiacciai e del permafrost → • ↑ innalzamento del livello del mare • Inondazione zone costiere → migrazioni di massa • ↑ Variabilità climatica: uragani, tifoni, siccità, esondazioni, ecc. • Acidificazione degli oceani →↑ riduzione del patrimonio ittico • Declino della produttività della terra • Collasso delle foreste tropicali
The decomposition approach IPAT approach (Holdren and Ehrlich, 1974): Impact Population Affluence Technology ( 1 ) I = P(Y/P)(I/Y) = Pyi I :impact P : world population Y: total income y = Y/P :per capita income i = I/Y :impact intensity
A version of the Kaya identity This approach may be applied specifically to the energy sector (Kaya, 1990): we may start from the following identity: ( 2 ) G = P(Y/P)(E/Y)(F/E)(G/F) = Pyefg G : GHGs emissions P : world population Y: total income y = Y/P :per capita income E : energy consumption e = E/Y :energy intensity F : fossil fuels consumption f = F/E : share of fossil fuels in energy consumption g = G/F : intensity of GHGs emissions per unit of fossil fuel consumed Taking the derivative of the logarithm of each variable we obtain ( 3 ) G* = P* + y* + e* + f* + g* where the asterisk indicates the rate of growth of the variable
G-Sustainability condition From the: ( 3 ) G* = P* + y* + e* + f* + g* We may derive conditions of G-sustainability A weak condition is that GHGs emissions do not increase through time ( 4 )G* = P* + y* + e* + f* + g* 0 this is insufficient to avoid global warming: current emissions are42 GtCO2-eper year while the biosphere may absorb only 5 GtCO2-eper year without ↑ concentration This is, however, the first intermediate goal to be reached and it is not easy: G* = 1.4 (1991-2000); 1.8 (1971-2000); projections (2005-2030) 1.3 - 2.6
Figure 1: total CO2 world emissions, 1960-2004 Source: authors’ elaboration on World Bank, World Development Indicators (2008)
G-sustainability condition scenario analysis (e.g. SRES, IPCC, 2000) So far decomposition approach { regional analysis (e.g. Raupach et al, 2007) conditions of sustainability We use it for sustainability analysis{ measures of (un-)sustainability Condition of sustainability for per capita income growth y* ( 5 ) y* - (P* + e* + f* + g*) or income growth Y* ( 6 ) Y* ≤ - (e* + f* + g*) Since f* and g* are expected to be stationary Y* may be positive only to the extent that e* is negative → income sustainability gap ( 7 ) y* - y*max = Y* - Y*max = Y* + e* + f* + g*
Table1: historical trends and future projections Source: authors’ elaboration on EIA (2008), British Petroleum (2008) and IEA (2008) data, in the light of ( 4 )G* = P* + y* + e* + g*+ f* 0
Comments to table 1 In the light of the identity ( 4 ): G* = P* + y* + e* + f* + g* 0 P* increases though at a decelerating rate y* is now decreasing but policy authorities will try hard to revive its growth In addition, in a BAU scenario, f* and g* are expected to remain stationary So we can stabilize G* only if ↓ e* ≥ ↑ P* + y* = Y* According to projections, ↓ e* (-2.4) insufficient to compensate ↑ Y*(4.0) In other words, we could have G-sustainability iff Y* ≤ 2.4 However this target is considered by governments too low (not only in China and India) although it is much too lax to stabilize climate change
Does the EKC apply to the energy system? The decomposition approach clarified how demanding are sustainability conditions for the existing energy system A more optimistic point of view relies on the alleged existence of an energy EKC per capita energy consumption (Schmalensee et al., 1998; Galeotti & Lanza, 1999) EKC { energy intensity (Suri and Chapman, 1998; Focacci, 2003) Strong doubts on its existence and significance (e.g. Borghesi and Vercelli, 2008): • Data problems • Different indicators provide different results • Omission of relevant explanatory variables • Cross-country vs. time-series In any case it would not imply G-sustainability: let us focus on energy intensity
The EKC in energy intensity Figura 4: Intensità energetica in paesi selezionati Energy intensity in selected countries over time Source: Colombo (1992)
Trends of energy intensity Fig. 2: Energy intensity by region (toe per 1000 $ of GDP- $1995 PPP) source: IEA (2004)
Energy EKC does not imply sustainability An inverse-U energy intensity relation with time does not imply an energy intensity EKC However, since per capita world income has grown in the past fairly regularly with time we should not be surprised that some authors found evidence of an energy intensity EKC (Sun, 1999); in any case: the existence of an energy EKC does not imply G-sustainabilty: The energy intensity EKC implies only that after the peak Y* > E* but this≠>y* + e* < 0 and a fortiori it ≠> G* = P* + y* + e* + f* + g* 0 Analogously for the per capita emissions EKC a reduction after the peak ofg*p ≠> G* 0 as P* could more than offset the negative growth of g*p
EKC in energy intensity e = E/Y after the peak: EKC y* > 0, e* < 0 ≠>y* + e* < 0 a fortiori it ≠>G* = P* + y* + e* + f* + g* 0 y = Y/P
EKC in carbon intensity gy = G/Y EKC y* > 0; after the peak: gy* < 0 G* = P* + y*+ gy* 0 ? y = Y/P
gy C B A k D E Decomposition approach and the EKC gp = ygy → gp* = y* + gy* → G* = P* + y* + gy* gp3 gp1 gp2 y
Policy implications G* = G*1 + G*2– A* = G*2 + P* + y* + e* + g* + f* – A* G* :net total emissions of GHGs (net of A*) G1:anthropic emissions G2:non-anthropic emissions A* :absorption by the biosphere Condition of sustainability: G* = 0 G*1 = A* – G*2 • We have thus to reduce anthropic emissions to less than 1/8 In addition we have to deplete the excessive concentration of GHGs so that we need to limit emissions to an even lower level
Policy implications How to comply with the condition G* = P* + y* + e* + f* + g* 0 ? • demographic growth P is a slow and inertial variable • the share of fossil fuels f* does not diminish in BAU scenarios notwithstanding the growing scarcity of oil and natural gas: IEA (2006): share non-FF on world total energy supply from 14% to 19,7% 1973-2004 (from 13.1% to 13.2% if nuclear excluded!!) • the carbon intensity g* of fossil fuels does not diminish in the BAU scenario because of the growing share of coal: trend expected to worsen after the peak • the energy intensity e* is the only factor diminishing in BAU projections but its negative growth is insufficient • In order to reduce G* without undermining y* we have to change the scenarios by forcing the transition to a different energy system: accelerate the negative growth of e*, f* and g* policy strategy { change the model of development
Table 2: expected average annual growth rate of CO2 emissions in the period 2005-2030 Legend: EIA-Reference = EIA (2008) Reference case scenario; EIA-High = EIA (2008) High case scenario; EIA-Low = EIA (2008) Low case scenario; IEA-Reference = IEA (2008) Reference case scenario; POLES = Prospective Outlook on Long-Term Energy Systems (European Commission, 2003); SRES = Special Report on Emission Scenarios (IPCC, 2000).
The “business as usual” scenario is becoming increasingly unsustainable The BAU scenario is inconsistent with sustainable development: -the gap diminished in the 1970s as a consequence of the oil shocks -this process of adjustment continued in the 1980s at a lower pace and petered out in the 1990s showing signs of inversion in the late 1990s and early 2000s inversion reflected in the projections for 2025 (or 2030) →the gap is much bigger: it is not sufficient to stabilise the emissions at the current level Tentative explanations: -Strong reduction of the price of fossil fuels since the early 1980s until the 2004 -Increasing faith in the omnipotence of markets believed to be able to solve promptly any sort of economic problem including the energetic ones → this new attitude weakened the policies of regulation of markets, including the energy markets However energy is a public good and energy markets are characterised by strong externalities → regulation is necessary
Concluding remarks Targets of energy policy: energy policies should aim to reconcile the energy scenario with sustainable development • Security of supply • Productive and allocative efficiency • Equitable distribution of energy facilities • Environmental protection → sustainable energy development