Download
1 / 17
170 likes | 359 Views
Single Molecule Fluorescence from Organic Dyes in Thin Polymer Films. Robin Smith and Carl Grossman, Swarthmore College March 5, 2003. Acknowledgements. Carl Grossman Swarthmore College François Treussart, Jean-François Roch, and Romain Alleaume

E N D
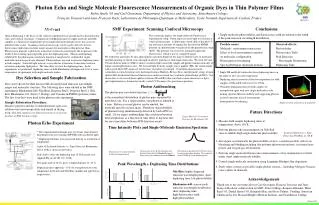
Single Molecule Fluorescencefrom Organic Dyes in Thin Polymer Films Robin Smith and Carl Grossman, Swarthmore College March 5, 2003
Acknowledgements Carl Grossman Swarthmore College François Treussart, Jean-François Roch, and Romain Alleaume Laboratoire de Photonique Quantique et Moléculaire, Ecole Normale Supérieure de Cachan, France
General Outline SMF Sample Fabrication Scanning Confocal Microscopy Photostability Photon Antibunching Single Molecule Emission Spectra Spectral Diffusion Photon Echo Measurements Dephasing Time
Photostability Photobleaching Blinking of fluorescence intensity versus time Dependence on excitation intensity (~2kW/cm2)
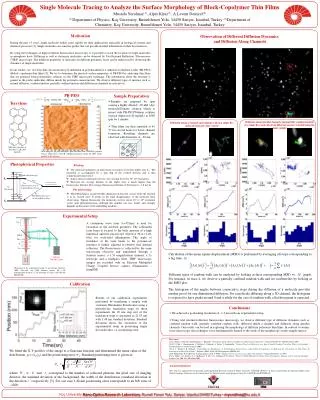
Photon Antibunching The coincidence count histogram is normalized to give the photon-pair correlation function . Since two fluorescence photons cannot be detected within an arbitrarily short time interval, this antibunching in the fluorescence of the emitter at is due to the finite radiative lifetime of the molecular dipole and proof that single molecule emission has been observed.
Single MoleculeEmission Spectra Integration Time Scale Fluorescence Lifetime
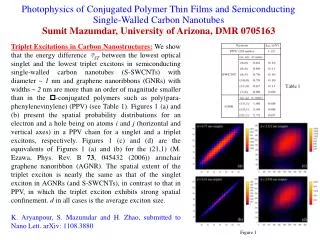
Dephasing Time Calculation Peak fit to Lorentzian lineshape function Based on classical model of electric dipole radiation Extract central and FWHM frequencies Calculate damping coefficient, the reciprocal of the dephasing time
Spectral Diffusion Fluorescence peak wavelength varies between 590 and 610 nm Broader spectrum at shorter wavelengths gives shorter dephasing times
Photon Echo Measurements Ultrafast optical dephasing (photon echo) measurements were performed on thin films of Nile Blue, Disperse Red, and Rhodamine-640 dyes. The experimental technique uses two-beam, time-delayed degenerate four wave mixing (DFWM) with incoherent light.
Dephasing Time Peak shift is twice the depasing time (T. Kobayashi, A. Terasaki, T. Hattori, and K. Kurokawa, Applied Physics B, 47, 107 (1988).) SMF gives dephasing times on the order of 4.7 fs at room temperature. Photon echo gives dephasing times approaching under 10 fs for extrapolation to room temperature,at which temperature peak shifts can no longer be resolved and interference fringes must be used for dephasing time determination.
Conclusions Dephasing times for single molecule and photon echo measurements are likely to agree Spectral diffusion in SMF spectra exists
Summary SMF Sample Fabrication Scanning Confocal Microscopy Photostability Photon Antibunching Single Molecule Emission Spectra Spectral Diffusion Dephasing Measurements