Download
1 / 21
210 likes | 230 Views
This article provides an overview of hemoglobin beta-subunit (HBB), its role as an oxygen transporter, and the diseases caused by beta-subunit mutations. It also discusses the primer design, DNA extraction, PCR, and sequencing techniques used for HBB analysis.

E N D
Hemoglobin Beta-subunit (HBB) Josh Bram and Wilton Smith
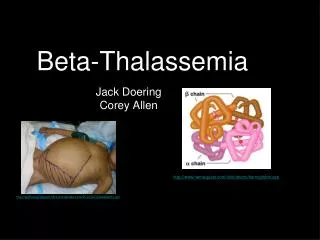
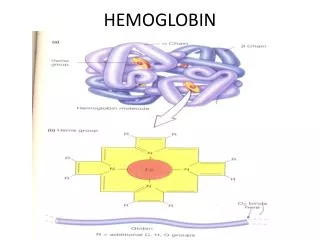
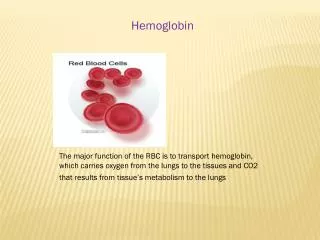
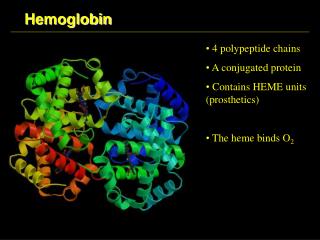
What is Hemoglobin? • Oxygen (and CO2) transporter for all vertebrates • Tetramer composed of four protein subunits (two alpha and two beta subunits) • Four Iron-containing haeme centers carry one oxygen molecule each • Beta-subunit mutations cause: • Sickle-cell anemia • Beta-thalessemia • 146 amino acid protein subunit
Hemoglobin - β Mutation Diseases Sickle Cell Anemia Beta Thalassemia Either a decrease or absence of beta-globin production Prevents Red Blood Cells from having enough Hemoglobin to supply oxygen to the body In mice, leads to sickly and weak individuals, or stillborn offspring • Mutation causing beta-globin units to stick together in masses and deform Red Blood Cells • RBCs take crescent shape and have many consequences • These include premature death and blocking of small blood vessels
Primer Design • Targeted Intron 2 (~700 base pairs) • Forward Primer (E2E3F): 5’ ctccatgtggatcctgagaac 3’ • GC%: 52.38 • 21 base pairs • Melting point: 55° C • Reverse Primer (E2E3R): 5’ acgatcatattgcccaggag 3’ • GC%: 50.00 • 20 base pairs • Melting Point: 55° C
DNA Extraction • QiagenDNeasy Blood & Tissue Kit • Two samples of P. leucopus extracted • Sample 1 extracted after 20 minute incubation • Sample 2 extracted after extended incubation • Both DNA samples yielded amplification results at one time or another; however, sample 2 proved to be a more reliable DNA source
Polymerase Chain Reaction (PCR) • 6.25 μL Mastermix • Mix composed of parts: • 50 x 1.25 μL 10x buffer = 62.5 μL • 50 x 1.25 μLdNTP = 62.5 μL • 50 x 0.1 μL TaqPolymerase = 5 μL • 4.25 μL dH2O • 1.00 μL DNA • 0.50 μL PF • 0.50 μL PR
Initial Identification • Six sample PCR • Sample DNA 1 at 50˚C, 55˚C, and 60˚C • Sample DNA 2 at 50˚C, 55˚C, and 60˚C • Successful gene amplification for Sample DNA 2 at 60˚C PCR (well seven) 2 kb 1.5 kb 1 kb 700 bp 500 bp 300 bp 100 bp
What happened? • Only Sample DNA 2 used for future PCR reactions • Gene amplification failed to occur at 60˚C (or any temperature) • Possible errors in PCR mix setup, PCR machine setup, random error, denatured primers
Successfully Identified 1, 1.5, and 2x primer concentrations all show amplification at approx. 700 bp • PCR run at multiple primer concentrations (1X, 1.5X, 2X) for Sample DNA 2 • Successful gene amplification for across all primer concentrations (wells two, three, and four)
Initial 50 μL PCR products • 50 μL PCR reactions for eventual sequencing • All PCR ingredient volumes multiplied by four for 50 μL PCR • Wells two and three show the HBB PCR products (1X and 1.5X Primer concentrations) HBB PCR Prodcuts, approx. 700 bp
PCR Product Cleanup for Analysis • Used Qiagen PCR Purification Kit • Cleanup up PCR Product to send for sequencing • Sent 5 μL of each primer, 10 μL of PCR product • Sent to Penn State sequencing facility in Chandlee building
HBB Forward Primer • Compared to Mussequence
HBB Reverse Primer • Compared to Mussequence
Population Samples • Six Population Sample PCR at 60˚C • TK20806 • TK20808 • TK20809 • TK20813 • TK20852 • TK20857 • All samples showed gene amplification East West
Site 179 Depending on reading frame: Cys to Tyr, Val to Met, Leu to Leu
Bibliography • http://www.uniprot.org/uniprot/P68871 • http://ghr.nlm.nih.gov/gene/HBB • http://biotools.umassmed.edu/bioapps/primer3_www.cgi • http://www.ncbi.nlm.nih.gov/genbank/ • http://www.megasoftware.net/ • http://nucleobytes.com/index.php/4peaks • http://bioinformatics.picr.man.ac.uk/research/software/tools/sequenceconverter.html