Download

1 / 24
240 likes | 256 Views
Measuring Evolution of Populations Hardy Weinberg. 5 Agents of evolutionary change. Mutation. Gene Flow. Non-random mating. Chemical Changes to DNA. Migration. Sexual Selection. Genetic Drift. Selection. Natural Selection Differential Survival. Small population.

E N D
MeasuringEvolution of Populations Hardy Weinberg
5 Agents of evolutionary change Mutation Gene Flow Non-random mating ChemicalChanges to DNA Migration Sexual Selection Genetic Drift Selection Natural SelectionDifferential Survival Small population
III. Genetic Equilibrium • Researchers know whether or not a population is evolving by tracking deviations from a baseline of genetic equilibrium. • If you notice, they violate all the mechanisms of microevolution. • Five conditions required for a stable gene pool: • Mutations do not occur • Population is infinitely large (genetic drift eliminated) • No gene flow • Random mating (no sexual selection) • All individuals survive and reproduce equally (no NS) • If these 5 things happen, new alleles are not introduced to a population and therefore, the population isn’t evolving. • This doesn’t happen in reality but the rate these change has a direct affect on the rate of evolution.
Genotype Frequencies Vs. Allele Frequencies Studying population genetics requires understanding alleles in a gene pool. Each individual has 2 alleles for each trait. This is the genotype, the phenotype is dependent upon this. The gene pool represents all available alleles in a population so genotypic and allelic frequencies always add up to 1. Genotype Frequency (frequency of EE) + (frequency of Ee) + (frequency of ee) = 1 Allele Frequency: (frequency of E) + (frequency of e) = 1
The Hardy-Weinberg Formula. Rules Determining Genetic Equilibrium… the BASELINE The Hardy-Weinberg formula can be used to determine if a population is in genetic equilibrium p2 + 2pq +q2= 1.0 is essentially: (AA) + (Aa) + (aa) = 1.0 It should be noted that H-W examines only traits that have 2 alleles! We couldn’t use it for our turtle population b/c there were 6 phenotypes. The frequency of the dominant allele (A) plus the recessive allele (a) equals 1.0 p + q = 1.0 Homozygous recessive Homozygous dominant Heterozygote
The Hardy-Weinberg Principle • The Hardy-Weinberg principle describes a population that is not evolving • If a population does not meet the criteria of the Hardy-Weinberg principle, it can be concluded that the population is evolving.
Finding out whether a population is evolving. The frequencies of wing-color alleles among all of the individuals in this hypothetical population of morpho butterflies are not changing; thus, the population is not evolving. Fig. 18-3a, p. 280
490 AA butterflies dark-blue wings 490 AA butterflies dark-blue wings 490 AA butterflies dark-blue wings 420 Aa butterflies medium-blue wings 420 Aa butterflies medium-blue wings 420 Aa butterflies medium-blue wings 90 aa butterflies white wings 90 aa butterflies white wings 90 aa butterflies white wings Starting Population Next Generation Next Generation Fig. 18-3b, p. 280
Class Example 1 • Let’s see if we can figure out allele frequencies for a population of pigs using H-W. • The goal is to find: q2, p2, p, q, 2pq,
Example: • White (pink) coats are dominant over black. • Can you identify who is dominant and recessive. • Yes. • Can you determine who has what alleles? • Only for the homozygous recessive! • You have to calculate the others….
Hardy-Weinberg Sample • Pink is dominant over black. • Calculate q2: Count the individuals that are homozygous recessive in the illustration above. Calculate the percent of the total population they represent. This is q2. q2 = 25%
Find q. Take the square root of q2 to obtain q, the frequency of the recessive allele. q = .5
Find p. The sum of the frequencies of both alleles = 100%, p + q = l. You know q, so what is p, the frequency of the dominant allele? p = 1 – q p = 1 - .5 p = .5
Find 2pq. The frequency of the heterozygotes is represented by 2pq. This gives you the percent of the population that is heterozygous for white coat: q = .5 p = .5 2pq = 2(.5)(.5) 2pq = .5 This represents the carriers of the recessive alleles
This shows the allele frequency in generation 1. • One would study the allele frequencies over several generations to see if the population is evolving.
What is the Point of H-W? • Why we use the H-W equation is to determine if a population is evolving. • By calculating the equilibrium in the beginning of a population we know the distribution of alleles. • If we examine a population later in time we can see if there is a change. • According to H-W, if there is no change there is no evolution. • If there is change evolution has occurred.
Independent Practice • Complete Question #1 on the handout. • You may ask questions – share out answers. • The goal is to find: q2, p2, p, q, 2pq • You start by determining the % of homozygous recessives in a population (this is q2) • It is also important why you are doing this… it is to determine the genetic equilibrium baseline for the population. • Complete the rest of the worksheet for classwork/homework.
Example Of Strong Selection Pressure • Tay Sachs • Primarily in Ashkenazi Jews & Cajuns • Recessive disease = aa • lysosomal storage disease • lack of one functional digestive enzyme in lysosome • build up undigested fat in brain cells • children die before they are 5 years old So where do new cases of Tay-Sachs come from?
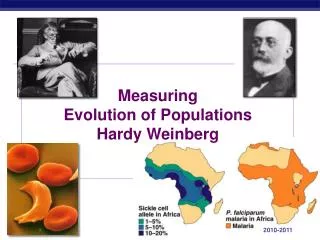
Example of heterozygote advantage • Sickle cell anemia • inherit a mutation in gene coding for one of the subunits in hemoglobin • oxygen-carrying blood protein • normal allele = Hb • mutant allele = Hs • recessive trait = HsHs • low oxygen levels causes RBC to sickle • clogging small blood vessels • damage to organs • often lethal
Malaria Single-celled eukaryote parasite (Plasmodium) spends part of its life cycle in red blood cells 1 liver 2 3
Sickle cell frequency • High frequency of heterozygotes • 1 in 5 in Central Africans = HbHs • unusual for allele with severe detrimental effects in homozygotes • 1 in 100 = HsHs • usually die before reproductive age Why is the Hs allele maintained at such high levels in African populations? Suggests some selective advantage of being heterozygous… HbHs
Heterozygote Advantage • In tropical Africa, where malaria is common: • homozygous dominant (normal) • reduced survival or reproduction from malaria: HbHb • homozygous recessive • reduced survival & reproduction from sickle cell anemia: HsHs • heterozygote carriers • survival & reproductive advantage: HbHs Hypothesis: In malaria-infected cells, the O2 level is lowered enough to cause sickling which kills the cell & destroys the parasite. Frequency of sickle cell allele & distribution of malaria
Concept Check • What is the usefulness of the H-W Law? • Homework • Complete the H-W Online Tutorial by your next period. • http://www.montereyinstitute.org/courses/AP%20Biology%20I/course%20files/multimedia/lesson23/lessonp.html?showTopic=2
Any Questions?? Any Questions?? Any Questions??