Measuring Evolution of Populations
260 likes | 566 Views
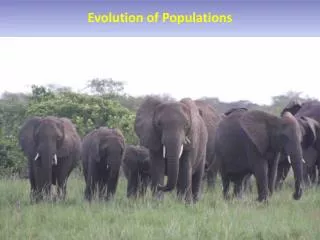
Measuring Evolution of Populations. Populations & Gene Pools. Concepts a population is a localized group of the same species that can interbreed gene pool is collection of alleles in the population Gene pool is all of the different genes in that population

Measuring Evolution of Populations
E N D
Presentation Transcript
Populations & Gene Pools • Concepts • a population is a localized group of the same species that can interbreed • gene pool is collection of alleles in the population • Gene pool is all of the different genes in that population • remember difference between alleles & genes!
Variation & Gene Pool • allele frequencyis the number of times that the allele occurs in the population • how many A vs a in whole population • Expressed in percentage (%) • i.e. 40% Black & 60% Brown
Evolution of populations • Evolution = change in allele frequencies in a population • hypothetical: what conditions would cause allele frequencies to not change? • non-evolving population REMOVE all agents of evolutionary change • very large population size (no genetic drift) • no migration (no gene flow in or out) • no mutation (no genetic change) • random mating (no sexual selection) • no natural selection (everyone is equally fit)
5 Agents of evolutionary change Mutation Gene Flow Non-random mating Genetic Drift Selection
Sources of Variation • Mutations • Caused by error in replication, radiation, chemicals in the environment • Only some mutations change the phenotype & affect fitness • Gene Shuffling: results from sexual reproduction • 23 pairs of chromosomes can make 8.4 million gene combinations • Crossing over causes differences in genes • Gene shuffling doesn’t change the allele frequency • Still have same # of alleles in population, but recombined
Single Gene vs Polygenic Traits • The number of phenotypes produced for a given trait depends on how many genes control the trait • Single Gene Trait: controlled by a single gene (2 alleles) • Polygenic Trait: traits controlled by two or more genes • Offers more variation
Evolution as Genetic Change • evolutionary fitness is an organism’s success in passing genes to the next generation • an evolutionary adaptation as any genetically controlled physiological, anatomical, or behavioral trait that increases an individuals ability to pass along its genes • Remember that evolution is any change over time in the relative frequency of alleles in a population. • This reminds us that it is populations, not individual organisms that can evolve overtime
Natural Selection on Single Gene Trait • Natural selection on single gene traits can lead to changes in allele frequencies and thus to evolution • i.e. Lizards
Natural Selection on Polygenic Traits • Natural selection can affect the distributions of phenotypes in any of three ways • Stabilizing Selection • Disruptive Selection • Directional Selection
Stabilizing Selection • When individuals near the center of the curve have higher fitness than individuals at either end of the curve
Disruptive Selection • When individuals at the upper and lower ends of the curve have higher fitness than individuals near the middle • Can create 2 distinct phenotypes
Directional Selection • When individuals at one end of the curve have higher fitness than individuals in the middle or at the other end
Genetic Drift • Genetic Drift: the random change in allele frequency • Occurs in small populations that break away from larger groups • In small populations, an allele can become more or less common by chance • Caused by individuals entering & leaving (migrating) • Ex. Founder’s Effect • When the allele frequency changes as a result of migration of a small group
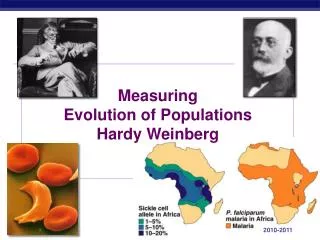
Hardy-Weinberg equilibrium • Hypothetical, non-evolving population • preserves allele frequencies • Serves as a model (null hypothesis) • natural populations rarely in H-W equilibrium • useful model to measure if forces are acting on a population • measuring evolutionary change G.H. Hardy mathematician W. Weinberg physician
Non-Evolving Population • Needs 5 conditions for equilibrium: • Random Mating • Large Population (No Genetic Drift) • No Migration In or Out • No Mutation • No Natural Selection
Hardy-Weinberg theorem • Counting Alleles • assume 2 alleles = B, b • frequency of dominant allele (B) =p • frequency of recessive allele (b) = q • frequencies must add to 1 (100%), so: p + q = 1 BB Bb bb
Hardy-Weinberg theorem • Counting Individuals • frequency of homozygous dominant: p x p = p2 • frequency of homozygous recessive:q x q = q2 • frequency of heterozygotes: (p x q) + (q x p) = 2pq • frequencies of all individuals must add to 1 (100%), so: p2 + 2pq + q2 = 1 BB Bb bb
B b BB Bb bb H-W formulas • Alleles: p + q = 1 • Individuals: p2 + 2pq + q2 = 1 BB Bb bb
Using Hardy-Weinberg equation population: 100 cats 84 black, 16 white How many of each genotype? q2 (bb): 16/100 = .16 q (b): √.16 = 0.4 p (B): 1 - 0.4 = 0.6 p2=.36 2pq=.48 q2=.16 BB Bb bb Must assume population is in H-W equilibrium! What are the genotype frequencies?
BB Bb bb Using Hardy-Weinberg equation p2=.36 2pq=.48 q2=.16 Assuming H-W equilibrium BB Bb bb Null hypothesis p2=.20 p2=.74 2pq=.64 2pq=.10 q2=.16 q2=.16 Sampled data How do you explain the data? How do you explain the data?
Speciation • Speciation: formation of a new species • Reproductive Isolation: • As new species evolve, populations become more reproductively isolated from each other. • Isolation Mechanisms: • Temporal Isolated • Two species reproduce at different times • Behaviorally Isolated • Can breed, but have different courtship behaviors • Geographically Isolated • Barriers such as rivers, mountains, bodies of water
Temporal Isolation Rana aurora - breeds January - March Rana boylii - breeds late March - May
Behavioral Isolation Eastern & Western Meadowlark
Geographic Isolation Albert & Kaibab Squirrels