Download
1 / 28
280 likes | 450 Views
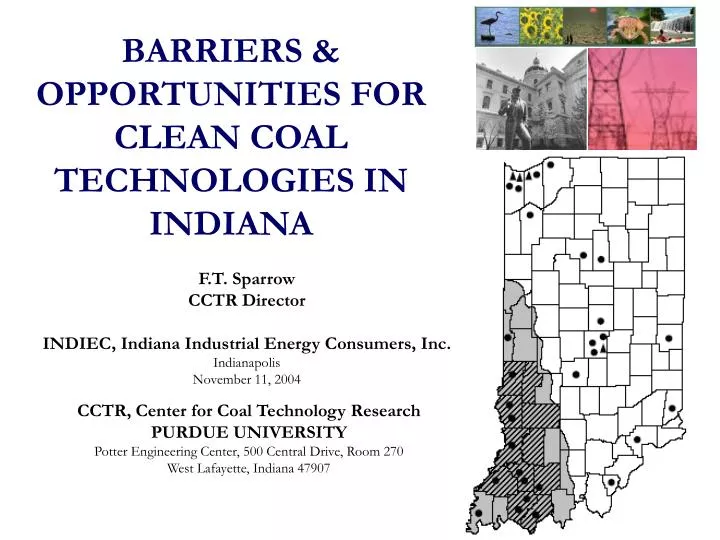
BARRIERS & OPPORTUNITIES FOR CLEAN COAL TECHNOLOGIES IN INDIANA. F.T. Sparrow CCTR Director INDIEC, Indiana Industrial Energy Consumers, Inc. Indianapolis November 11, 2004. CCTR, Center for Coal Technology Research PURDUE UNIVERSITY Potter Engineering Center, 500 Central Drive, Room 270

E N D
BARRIERS & OPPORTUNITIES FOR CLEAN COAL TECHNOLOGIES IN INDIANA F.T. Sparrow CCTR Director INDIEC, Indiana Industrial Energy Consumers, Inc. Indianapolis November 11, 2004 CCTR, Center for Coal Technology Research PURDUE UNIVERSITY Potter Engineering Center, 500 Central Drive, Room 270 West Lafayette, Indiana 47907
Q. Why The Rush to Clean Coal Technologies (CCT) in Indiana? A. #1.National Reasons: Combination of high gas prices, expectation of tighter environmental rules regarding power plants are national drivers. • #2. Four Midwest Regional Drivers: (a) Regional need for new base load capacity (Indiana will need 2500MW in 8 years, 6000MW in 17 years). (b) Two of three states in the Illinois Basin are still regulated, in their power to help reduce uncertainty by rate-basing investment, offer rate of return adders for CCT (SB 29).
Q. Why the Rush to CCT in Indiana? - continued (c) Illinois Basin Coals have several advantages over Powder River Basin Coals when used in gasifiers Illinois Basin Coals: • Have higher heat content than Powder River Basin coals (PRB) – delivered cost per ton similar but Illinois coals have lower cost per Btu. • Provide significantly reduced transportation costs. • Possess higher chlorine content making it easier for zero mercury emissions. Illinois Basin coals have a high sulfur content – but this disadvantage is negated with IGCC technology because of ease of sulfur removal in the gasification process.
Q. Why the Rush to CCT in Indiana? - continued (d) Finally Indiana’s aging boilers and generators offer an opportunity for repowering projects – retrofit with gasifiers, or fluegas/oxygen combustion (Edwardsport).
CCTR Indiana Center for Coal Technology Research • July 2002: The CCTR is established, Indiana Senate Enrolled Act No. 29, July 2002. • July 2003: House Enrolled Act No. 1166, creates CCTR Advisory Panel and provision for public education. • June 2004: CCTR Advisory Panel appointed. • August 18, 2004: First CCTR Workshop. • Fall 2004/Spring 2005: Four Consultation Workshops are being planned.
What are the Surrounding States Doing? Illinois • Coal Research Program – granted over $60 million in last two decades, through Illinois Clean Coal Institute at SIU. • Coal Demonstration Program – state’s $120 million has attracted over $200 million in federal funds, over $450 million in private and public cost-sharing. Ohio • Coal Research Grant Program – through Ohio Coal Development Office – almost $4 million to fund 19 projects in 2000. • Ohio Coal Research Consortium – over $1 million/year at six universities.
What are the Surrounding States Doing? Kentucky • Center for Applied Energy Research at University of Kentucky –started in 1972 as Kentucky Coal Utilization Research Program. • Total funding authorization was $50 million. • Governor’s current budget provides $4 million for coal-bed methane production, $3 million for clean coal combustion.
COAL RESERVES IN THE U.S. AND INDIANA • Current U.S. recoverable reserves are 498 billion tons, enough to last for over 450 years. • Indiana recoverable reserves are 9.6 billion tons, enough to last for over 250 years (producing 35 million tons per year). • Indiana has more energy underground in the form of coal reserves than the U.S. does in the form of oil and gas reserves.
INDIANA COAL FACTS - 2002 • Indiana mines are part of the Interior Coal-Producing Region, Illinois Coal Basin. • Economic impact: $675 million. • Employment impact: >14 thousand people. • Strong link: coal with low cost electricity. • Coal is a significant contributor to the economy of the state.
APPLIED R&D PROGRAMS FOR COAL Helping to strengthen the economy of Indiana: BY: Assisting in the development of strategic long-term coal related proposals THROUGH: Appropriate policies, most cost effective new technology investments, reduced transportation costs, regional cooperation WITH: Increases in Indiana’s coal production WHILE: Having concern for health and environment
INDIANA COAL PRODUCTION Production of 35 million tons of coal in 2002 Indiana coal has high heat content and high sulfur content 78% of production is from surface mining. Is there a gradual return to underground mining? At present Indiana has highest percentage of surface mining in the Midwest (next highest is Ohio with 49%)
INDIANA COAL TRADING Indiana is a major importer of coal • Consumption 66 million tons in 2002 • Imports 34 million tons • Exports 3 million tons Where do coal imports come from and where do coal exports go to? This network of trade flows needs to be understood for future planning.
INDIANA COAL TRADE FACTS AND RESPONSE • Complex flow of coal supplies • Indiana imports ½ of its total coal needs • Wyoming is biggest supplier of out-of-state coal • Majority of coal imports are for electricity generation • Strategy for import substitution? • Strategy for increase in exports? • Investment strategy for increased mineproduction? Coal directly Coal by wire
INDIANA COAL IMPORTS - 2002 State Consumption Total of 66,269Thousand short tons & methods of transportation Import In state: 32,146 Total 23,370 Electricity Generation Rail 9,311 River 502 Conveyer 577 Truck 12,980 8,455 Industrial Plants Truck 321 Residential/Commercial Truck Wyoming: 13,606 Total 13,606 Electricity Generation Rail 7,189 River 6,417 Montana: 1,441 Total 1,441 Electricity Generation Rail Import Ohio: 124 Total 105 Electricity Generation Rail 36 River 6 Truck 63 20 Industrial Plants Truck Utah: 281 Total 281Industrial Plants Rail Colorado: 227 Total 227Industrial Plants Rail Import Pennsylvania: 429 Total 419 Electricity Generation River 350 Truck 68 (Bituminous) 9 Residential/Commercial 1 Industrial Plants Truck (Anthracite) Both Res. & Ind. Import Illinois: 5,935 Total 5,839 Electricity Generation Rail 3,445 River 930 Truck 1,464 96 Industrial Plants River Import West Virginia: 7,942 Total 2,111 Electricity Generation Rail 1,114 River 968 Truck 28 4,634 Coke Plants Rail 4,163 River 420, Truck 51 1,197 Industrial Plants Rail 949 River 246 Truck 2 Virginia: 2,602 Total 1,157 Electricity Generation Rail 481 River 677 754 Coke Plants Rail 754 691 Industrial Plants Rail 676 River 15 Kentucky: 994 Total 314 Electricity Generation Rail 178 Truck 136 86 Coke Plants Rail 75 Truck 11 594 Industrial Plants Rail 507 River 49 Truck 38 Import Alabama: 540 Total 540Coke Rail State Totals: 48,643 Electricity Generation 6,014 Coke Plants, 11,281 Industrial Plants, 331 Resid/Com Source: http://www.eia.doe.gov/cneaf/coal/page/coaldistrib/d_in.html
LOW SULFUR IMPORTS TO INDIANA Indiana Production Profile Wyoming Production Profile 73% consumed for Indiana electricity Wyoming consumes < 1/12 of all it produces Wyoming produces 1/3 of nation’s coal Major imports of Wyoming’s low sulfur coal have dramatically affected Indiana’s coal trade situation as result of more stringent environmental standards.
INDIANA COAL EXPORTS - 2002 State Production Total of 35,391Thousand short tons & methods of transportation Wisconsin: 757 Total 385 Electricity Generation Rail 372 Industrial Plants Rail 68 River 304 Export In state: 32,146 Total 23,370 Electricity Generation Rail 9,311 River 502 Conveyer 577 Truck 12,980 8,455 Industrial Plants Truck 321 Residential/Commercial Truck Iowa: 146 Total 9 Electricity Generation River 137 Industrial Plants Rail 105 River 32 Export Minnesota: 8 Total 8 Electricity Generation Rail Missouri: 19 Total 19 Industrial Plants River Export Ohio: 178 Total 178 Electricity Generation River Export Illinois: 468 Total 466 Electricity Generation River 140 Truck 326 2 Industrial Plants Railroad 2 Tennessee: 6 Total 6 Residential/Commercial River Export Export Florida: 162 Total 162 Electricity Generation River Kentucky: 1,499 Total 1,461 Electricity Generation Rail 808 River 481 Truck 171 39 Industrial Plants Truck State Totals: 26,038 Electricity Generation 9,023 Industrial Plants, 327 Residential/Commercial Source: http://www.eia.doe.gov/cneaf/coal/page/coaldistrib/o_in.html
INDIANA COAL EXPORTS Indiana Coal Production and Consumption Decline in Indiana Coal Exports What has caused the decline in Indiana’s coal trade and what response is to be made to this?
The Midwest states are all very dependent on coal imports from the Western Region and Indiana exports suffer Similarly to the electricity network of the region and the creation of MISO can there be a similar regional level of cooperation with coal technology development? A regional approach could have important consequences for the location of the FutureGen project? COOPERATION WITH NEIGHBORS
EXPANDING INDIANA COAL USEBY THE IRON AND STEEL INDUSTRY • Currently, very little Indiana coals utilized by the industry. • Two opportunities – in coke blends and blast furnace injection. • Two studies – IGS Report 64, DOE Clean Coal Technology Report. • Coke blends: Indiana coals limited by strength, moisture problems – nonetheless, “Indiana coal could be successfully incorporated in amounts up to 45% of the blend” – potential between 2 to 3-½ million tons/year.
EXPANDING INDIANA COAL USEBY THE IRON AND STEEL INDUSTRY • Blast furnace injection: could replace up to 40% of coke charge; in competition with gas. Coals with high combustibility, high coke/coal replacement ratios, low sulfur preferred. • Total potential: 4 ½ to 5 ½ million tons/year. • Problem: best Indiana coals for both uses are Brazil formation, with limited reserves.
COAL BY WIRE • Indiana electric utilities currently export about 850 MW under firm capacity agreements. • Additional 1,200 MW exported from Clifty Creek plant. • Depending upon load patterns and availability of generation units, Indiana may be net electricity importer or exporter. • EIA and SUFG project substantial need for base load electric generation resources over next 15 to 20 years.
FUTURE COMPETING TECHNOLOGIES FOR POWER GENERATION • Power generation from coal becomes more competitive as the capacity factor increases • It appears likely that future base load needs in Indiana (6000 MW by 2021) will come from coal based plants while the peaking and cycling demands will be met by gas fired turbines and combined cycle plants
FUTURE COAL-BASED POWER GENERATION TECHNOLOGIES How extensive a role is IGCC technology to have in Indiana and the Midwest?
FUTURE COAL-BASED POWER GENERATION TECHNOLOGIES • Requirements for future coal-based power plants include • High Efficiency • Low Emissions (including CO2) • Versatility • Competing technologies include • Pulverized Coal Steam Turbine • Integrated Coal Gasification Combined Cycle (IGCC) • Flue Gas Recycle • The IGCC process best fits the criteria for future plants, exhibiting a high efficiency, low emissions with the possibility of economical CO2 capture, and versatility to produce power, syngas, or hydrogen. The sulfur is captured in a form that provides an additional economic advantage.
REGULATORY UNCERTAINTY “Ostrich” Technology Cost/Unit “Bite the Bullet” Technology Tighter Regulation “Bite the Bullet”: Invest now, pay the price, and protect against possible legislation. “Ostrich”: Ignore the possibility of tighter regulation, and hope it doesn’t come.
CFB NGCC IGCC PC PC Subcritical Supercritical EPC Cost, $/kW 1,250 1,300 1,300 440 1,300 Ave. Heat Rate, 9,300 8,700 9,800 7,200 8,650 Btu/kWh Cost of Electricity 53 53 54 52 55 $/MWh GENERATING TECHNOLOGY OPTIONS Source US Department of Energy Source: EPRI estimates Integrated Gasification Combined Cycle (IGCC) Plants Take away: EPRI studies are indicating that IGCC Plant costs are approaching those of conventional technologies; this is yet to be tested in the marketplace with real contracts.
IGCC – SUPERIOR ENVIRONMENTAL PERFORMANCE Source Eastman Chemical Company Take away: IGCC’s emissions are the lowest of any coal-based technology.
IMPACT OF COAL TYPE ON TECHNOLOGY SELECTION Choices regarding coal type strongly influence technology selection Source: EPRI Take away: IGCC plants become less competitive with low-BTU coals. IGCC is not a silver bullet; having other technology options available is strategically important.