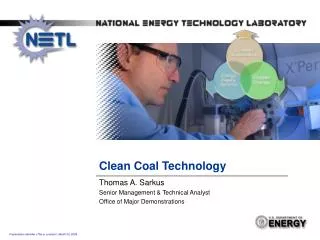
Clean Coal Technology
Clean Coal Technology. Thomas A. Sarkus Senior Management & Technical Analyst Office of Major Demonstrations. U.S. Affluence. UK. Qatar. Mexico. Bahrain. Peru. GDP per Capita ($ / person / yr). South Africa. Congo. Bulgaria. Eritrea. Poverty. Annual Energy Consumption per Capita

Clean Coal Technology
E N D
Presentation Transcript
Clean Coal Technology Thomas A. Sarkus Senior Management & Technical Analyst Office of Major Demonstrations
U.S. Affluence UK Qatar Mexico Bahrain Peru GDP per Capita ($ / person / yr) South Africa Congo Bulgaria Eritrea Poverty Annual Energy Consumption per Capita (kgoe / person / yr) Energy = Quality of Life Poverty Reduces Global Security World Resources Institute Database, accessed June 1, 2005 http://earthtrends.wri.org/searchable_db/
Coal-fired generation and GDP have grownat nearly the exact same pace over last 30 years Coal Use Linked to Economic Growth GDP Coal-Fired Generation Electricity Generation Total Energy Consumption GDP: U.S. DOC, Bureau of Economic Analysis Energy & Electricity: EIA, Annual Energy Review 2003
U.S. Electricity Generation, by Source(Billion KiloWatt-Hours)
U.S. Capacity & Generation 2007 Nameplate 2007 Net Generation Capacity (MWe)(000 MW-hrs) Coal 336,040 - 30.9% 2,016,456 - 48.5% Natural Gas 449,389 - 41.3% 896,590 - 21.6% Nuclear 105,764 - 9.7% 806,425 - 19.4% Hydro 77,644 - 7.1% 247,510 - 6.0% Petroleum 62,394 - 5.7% 65,739 - 1.6% Renewables 32,676 - 3.0% 105,238 - 2.5% Other 23,884 - 2.2%18,788 - 0.4% Total 1,087,791 - 99.9% 4,156,745 - 100%
2007 U.S. Coal Mining Production by State (Million Short Tons) WY WV MT ND PA KY 453.6 43.4 29.6 153.5 65.0 IN OH IL 115.3 MD VA CO 35.0 22.6 UT 2.3 32.4 25.3 36.4 MO 24.3 KS 0.2 0.4 TN OK 2.7 NM AZ 1.6 AR 0.1 AL 8.0 0.1 24.5 MS 19.3 3.5 TX LA 3.1 41.9 1) Wyoming’s bar is 1/3 height because of vertical limitations 2) Alaska produced 1.3 million short tons
WV 92 SD 3 NE NC 20 80 KS MD 36 30 SC AZ 42 TX NM 41 28 FL 147 68 2007 U.S. Coal-Derived Electric Generation by State (MegaWatt-hours x 100,000) OH PA NY 21 IN MI ME WA MT ND NH MN WI 123 .4 133 9 4 29 71 IL 18 32 MA WY 40 OR 12 KY 123 ID 4 CT .1 IA 43 4 95 NJ MO 38 90 10 NV DE VA 6 UT CO 75 7 TN 35 CA 36 37 2 60 AL GA OK AK 78 34 AL 90 26 MS 17 LA 23 1) Hawaii produces 1.6 megaWatt-hours x 100,000 2) Alaska produces .6 megaWatt-hours x 100,000
<7.9¢ 8¢ - 11.9¢ >12¢ Hydro Coal Usage Translates to Reliable, Affordable Electricity 14.6¢ 2% 6.4¢ 8% 6.4 93% 7.1¢ 63% 15.2¢ 15% 7.4¢ 59% 7.0¢ 8% 8.5¢ 63% 5.1¢ 1% 6.9¢ 43% 8.5¢ 63% 5.3¢ 95% 9.1¢ 54% 6.8¢ 76% 6.3¢ 61% 7.9¢ 86% 10.0¢ 22% 6.5¢ 94% 8.5¢ 48% 5.3¢ 98% 6.4¢ 82% 7.1¢ 45% 7.8¢ 67% 12.8¢ 1% 6.8¢ 72% 6.6¢ 82% 7.8¢ 61% 5.8¢ 93% 7.1¢ 63% 7.3¢ 47% 7.2¢ 40% NH 14.0¢ 17% RI 13.1¢ 0% CT 16.4¢ 11% NJ 13.0¢ 16% MA 15.2¢ 26% VT 12.0¢ 0% DE 11.4¢ 66% MD 11.5¢ 59% 7.0¢ 47% 8.5¢ 36% 7.4¢ 77% 7.9¢ 62% 7.6¢ 54% 8.0¢ 35% ¢ = Average Retail Price per KiloWatt-Hour % = Percent of Total Generation from Coal 10.1¢ 36% 8.4¢ 25% 10.3¢ 30% 13.3¢ 9% 21.3¢ 14% DOE/EIA Form EIA-861, 2007 data, average retail price of electricity by State DOE/EIA Form EIA-906, 2007 data, percent of total generation from coal
United States World Energy Demand 2030 Energy Demand Today 101 QBtu / Year85% Fossil Energy 131 QBtu / Y ear86% Fossil Energy United States 475 QBtu / Year 80% Fossil Energy 725 QBtu / Year 81% Fossil Energy World Fossil Energy Will Continue to Dominate U.S. data from EIA, Annual Energy Outlook 2007, years 2006 and 2030; world data from EIA, World Energy Outlook 2006, years 2004 and 2030
Some Clean Coal Successes • Advanced SO2 Scrubbers • Pure Air (Bailly), CT-121 (Yates) & S-H-U (Cayuga) • NOx Control Technologies • Low-NOx burners, Reburning, SNCR & SCR • Hazardous Air Pollutants • Focus on Hg • Fluidized Bed Combustion • Fuel flexibility; can handle even waste coal • IGCC • Wabash River & Tampa/Polk
U.S. Coal-Fired Power PlantsAir Pollution Control Device Summary MWe % of MWe No. Units % Units Particulate Controls ESP 261,411 84% 888 69% Fabric Filter 32,187 10% 164 13% Others 16,116 5% 244 19% Total PM 309,714 100% 1,296 100% SO2 Controls Wet Scrubber 129,445 42% 289 22% Dry Scrubber 15,176 5% 51 4% Reagent Injection 5,828 2% 75 6% Total SO2 150,449 49% 415 32% Post-Combustion NOx Controls SCR 100,099 32% 199 15% SNCR 18,358 6% 100 8% Total NOx 118,457 38% 299 23% Source: U.S. EPA Nat’l Electrical Energy Data System for 2006 (NEEDS 2006)
Evolution of Air Pollution Controls • Particulate Matter (PM), 1950s-1960s • Sulfur Dioxide (SO2), 1970s-1990s • Nitrogen Oxides (NOx), 1990s-2000s • Mercury (Hg), 2000s-2010s • Carbon Dioxide (CO2), 2010s-2020s
Annual CO2 Emissions Extremely Large • 1 million metric tons of CO2: • Every year would fill a volume of 32 million cubic feet • Close to the volume of the Empire State Building Data sources: Mercury - EPA National Emissions Inventory (1999 data); SO2 - EPA air trends (2002 data); MSW - EPA OSWER fact sheet (2001 data); CO2 - EIA AEO 2004 (2002 data)
Comparison of Coal-Based Power Generation Platform Technologies • Pulverized Coal (pc) Boilers • Commercialized in 1920s-1930s • 5000 units world-wide; >1100 in US • Unit sizes up to ~1400 MW • Fluidized Bed Combustion (FBC) Boilers • Commercialized in 1970s-1980s • 500 units world-wide; 150 in US • Unit sizes up to ~300 MW • Costs ~5-10% higher than pc units • Integrated Gasification Combined-Cycle (IGCC) Power Plants • Commercialized in 1980s-1990s • 6 coal-based units world-wide; 2 in US • Unit sizes up to ~300 MW • Costs ~ 10-20% higher than pc units
Next Steps for Coal-Based Power Generation Platform Technologies • Pulverized Coal Combustion • Tightened emissions controls • Post-combustion CO2 capture • Oxy combustion, temperature, pressure • Fluidized Bed Combustion • Supercritical CFB • Pressurized CFB • IGCC • Larger units, low cost O2 supply, low rank coals, improved refractory, nth plant designs • CO2 capture & sequestration, efficiency
Potential for lower emissions & higher efficiencies Allows coal to benefit from improvements in gas turbine technology Versatile – feedstock flexibility & multiple products possible (e.g.,electricity, chemicals, transportation fuels, synthetic natural gas) Promising “coal-to-hydrogen” option Easily adapted for CO2 sequestration R&D Pipeline Reducing Cost & Improving Efficiency Gasifier/refractory material Low-cost oxygen Gas separation membranes Why IGCC? • Producing concentrated stream of CO2 at high pressure • Improves sequestration economics • Reduces efficiency penalty
U.S.Commercial-Scale Coal-Based IGCC Power Plants Wabash River • W. Terre Haute, IN • Operations began 11/95 • 1996 Powerplant Award • 296 MWe (gross); 262 MWe (net) Tampa Electric • Mulberry, FL • Operations began 9/96 • 1997 Powerplant Award • 315 MWe (gross); 250 MWe (net)
PPII & CCPI Demonstration ProjectsLocations & Cost Share Excelsior Energy IGCC $2,155M – Total $36M – DOE Wisconsin Electric Power Co. TOXECON Multi-Pollutant Control $53M – Total $24.9M – DOE Great River Energy Lignite Fuel Enhancement $31.5M – Total $13.5M – DOE CONSOL/Greenidge Multi-Pollutant Control $32.7M – Total $14.3M – DOE NeuCo, Inc. Integrated Optimization Software $19M – Total $8.5M – DOE Emission Control Fuel Advanced Power Systems Pegasus Technologies Adv. Sensor / Optimization Hg / Multi-pollutant $15.5M – Total $6.1M – DOE Southern Company IGCC-Transport Gasifier $1.623B – Total $294M – DOE CCPI
Technological Carbon Management OptionsPathways for Reducing GHGs -CO2 Improve Efficiency Sequester Carbon Reduce Carbon Intensity • Renewables • Nuclear • Fuel Switching • Demand Side • Supply Side • Enhance Natural Sinks • Capture & Store • All options needed to: • Affordably meet energy demand • Address environmental objectives
National Atlas Highlights - 2008 U.S. Emissions ~ 6 Billion Tons CO2/yr all sources ~ 2.1 Billion Tons CO2/yr coal-fired power plants Saline Formations North American CO2 Storage Potential (Billion Metric Tons) Oil and Gas Fields Unmineable Coal Seams Hundreds of Years Storage Potential Conservative Resource Assessment Available for download at http://www.netl.doe.gov/publications/carbon_seq/refshelf.html
Enhanced Oil Recovery – Beneficial Use of CO2 • EOR increasing its role in domestic oil production • EOR: 650,000 bbls/day → 13% of domestic production • CO2-EOR: 237,000 bbls/day & growing • 90 billion barrels of light oil can yet be recovered in the U.S. using EOR • Reduces cost of CCS • Lowers carbon footprint of transportation sector • Oil produced with “next generation” CO2-EOR may be well-better than carbon neutral • Increases energy security
Regional CarbonSequestration Partnerships • Representing: • >350 Organizations • 41 States • 4 Canadian Provinces • 3 Indian Nations • 39% cost share Creating Infrastructure for Wide Scale Deployment: Characterization Phase • 24 months (2003-2005) Validation Phase • 4 years (2005 - 2009) • 7 Partnerships (41 states) • 25 Geologic field validation tests Deployment Phase • 10 years (2008-2017) • Several large injection tests in different geology
Fort Nelson CO2 Acid Gas Injection Project Test location Williston Basin CO2 Seq. and EOR Test Injection of CO2 into Moxa Arch Big Sky Large-Scale CO2 Storage in Mt. Simon Sandstone MRCSP PCOR MGSC Seq. of CO2 from Oxy- Combustion Large-Volume Seq. Test Ethanol Plant Source SWP WESTCARB SECARB Deep Saline Deployment Project Saline Formation Demonstration Regional Carbon Sequestration PartnershipsDeployment Tests
Past Capacity Announcements vs. Actual Delays in Implementation Historically, actual capacity has been shown to be significantly less than proposed capacity. For example, the 2002 report listed 11,455 MW of proposed capacity for the year 2005 when actually only 329 MW were constructed. Source: 2007 data Global Energy Decisions – Velocity Suite 2002 – 2005 data – Previous NETL Tracking New Coal-Fired Power Plants Reports
Our Workforce & Skills Challenge “Valley of Lost Experience” A Two-Decade Gap