Optimization of Electron Detector Array for Gamma Detection Above 50TeV
This study focuses on optimizing the KM2A array for gamma detection above 50TeV using 5137 EDs. It compares experiment results with GEANT4 simulations, analyzing the performance of scintillation detectors and WLS fibers for engineering array design.

Optimization of Electron Detector Array for Gamma Detection Above 50TeV
E N D
Presentation Transcript
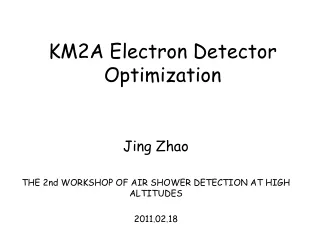
KM2A Electron Detector Optimization Jing Zhao THE 2nd WORKSHOP OF AIR SHOWER DETECTION AT HIGH ALTITUDES 2011.02.18
outline • Optimization intention • Design and implemention in GEANT4 • Comparison with experiment and simulation
Optimization intention • KM2A array for γdetection >50TeV, it needs 5137 EDs. • For one ED: Measurement range of charged particles:1-4000, Resolution: 25%@1particle,5%@4000 particles >15p.e. in case of 1 particle(for the electronic need) • A GEANT4-based simulation package have been developed in the main purposes as below, • To confirm the performances of “tile”, ED’s prototype, used in the engineering array now • To optimize the new design of ED
ED prototypes used in Engineering array and their performances Scintillation detectors, called “cassette”, were chosen to apply for the engineering array, while here PHOTONIS XP2012B PMTs were used in light detection. “cassette” WLS fibers Fig. One prototype of ED , scintillation detector, called “cassette” clear fibers 16 tiles (4×4 tiles)consist of one “cassette”, which efficient detection area is 1.0 m2. “Tile” Fig. two scintillation units (called “tile”, 25cm×25cm×2cm each)
Design and implementation in Geant4 • Optical process • Optical Photon Production • Cerenkov Process • Scintillation Process • Transition Radiation • Processes affecting Optical Photons • Refraction and Reflection • Bulk Absorption • Rayleigh Scattering Class Categories (experimental setup)
Input scintillator emission spectrum WLS fiber absorption length WLS fiber absorption and emission spectrum Implementation in Geant4 • Geometry Implementations 1. Scintillator : Size : 25x5cm -> 25x25cm Materal: Polystyrene Yield: 8000/MeV n = 1.60 2.Wavelength shift plastics/optical fiber d = 1.50 mm (tclad = 0.03d) n = 1.60, core 1.49, cladding layer Need input parameters for WLS plastics. like absorption length,emission spectrum • Surface condition( Ground) for total internal reflection.
scintilllator PMT trigger 4 1 2 3 1cm 5cm 13cm Experiment 1:Direct readout • Cosmic- telescope The scintillator size: 25x25x2cm3
4 1 2 3 1cm 5cm 13cm Comparison result 1 :direct readout
scintillator PMT trigger 25x5x1cm3+1fiber 25x25x1cm3+5fiber (kedi) 25x25x2cm3+8fiber (UPS89) Experiment 2:Fiber readout test1 test2
Comparison result 2:fiber readout Fiber readout test1 Fiber readout test2
Check the photons transmission To understand the above big differences between the simulation results and the experimental ones , two estimations were done as follows: It seems there was no problem in the tracking processes of our package. The big differences indicate that the present description of the coupling between fibers and scintillators is too ideal to simulate the roughness of the surfaces of those grooves or holes properly. In addition, some parameters, such as fiber absorption length, should be considered in further step. But the about disscussion would not affect the application of present simulation package for optimization of ED design because the simulation results are consistent with the experimental ones in proportion. 1.The ratio between the number of photons passing through the fibers and the number of photons generated in the scintillator is about 6.1%, while the acceptance is 6% in view of the solid angle of the fibers in scincillator. 2.In veiw of the isotropy of re-emitted photons in the WLS fiber, the ratio between the trapped photos (due to the total internal reflection) and all re-emitted ones is 12%, which is consistent with the simulation values.
Blue:8 fbier red:5fiber optimization of the tile size and fiber number Using 25x25x1cm3+5fiber(kedi) scintillator as 1
summary • A GEANT4-based simulation package has been developed. • Results are consistent with the ones of direct readout experiment. • On the optimization of ED prototype with Fiber readout, there are big differences on light collection betweent the simulation results and the experimental ones.These simulation studies continue.