Download
1 / 6
60 likes | 188 Views
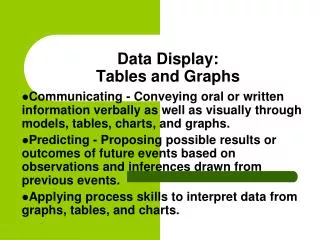
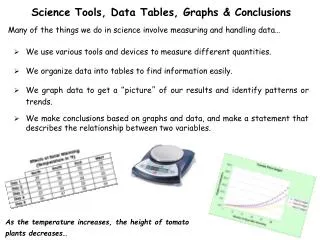
Use of Graphs/Tables. By:Brandon Gilbert. Bar graphs are an excellent way to show results that are one time data, that aren't continuously changing data - sample uses are surveys, inventories, etc. Bar-Graphs.

E N D
Use of Graphs/Tables By:Brandon Gilbert
Bar graphs are an excellent way to show results that are one time data, that aren't continuously changing data - sample uses are surveys, inventories, etc. Bar-Graphs you use bar graphs to show what has best score ex: east 3rdQtr has bigger number over all
You use line graphs to show change over time. Line Graphs Line Graphs
Percent Graphs • You use percent graphs to show how much out of a certain number ex: 100 out of 400 kids stayed home
Frequency Table • You use these to show or keep track of the progress of something like a baseball game.
Credits http://images.google.com/images?um=1&hl=en&safe=active&rls=com.microsoft:en-us:IE-SearchBox&rlz=1I7WZPA_en&tbs=isch%3A1&ei=xbDNS9eMH4XkNJijoEQ&sa=X&oi=spell&resnum=0&ct=result&cd=1&q=math+tally+table&spell=1&start=0 http://images.google.com/images?um=1&hl=en&safe=active&rls=com.microsoft%3Aen-us%3AIE-SearchBox&rlz=1I7WZPA_en&tbs=isch%3A1&sa=1&q=math+percent+graphs&aq=f&aqi=&aql=&oq=&gs_rfai=&start=0 http://images.google.com/images?um=1&hl=en&safe=active&rls=com.microsoft%3Aen-us%3AIE-SearchBox&rlz=1I7WZPA_en&tbs=isch%3A1&sa=1&q=math+line+graph&aq=1&aqi=g2&aql=&oq=math+line&gs_rfai=&start=0 http://www.fjhs.ednet.ns.ca/math/circle%20graph%201.gif http://images.google.com/images?um=1&hl=en&safe=active&rls=com.microsoft%3Aen-us%3AIE-SearchBox&rlz=1I7WZPA_en&tbs=isch%3A1&sa=1&q=math+bar+graphs&btnG=Search&aq=f&aqi=&aql=&oq=&gs_rfai=&start=0 http://www.edu.gov.mb.ca/k12/tech/lict/let_me_try/g6/mh132-10.gif this slide is by: Brandon Gilbert :][: