MOTION GRAPHS
Integrated Physics and Chemistry. MOTION GRAPHS. Graphs of Motion. Equations and tables are not the only way to describe relationships such as velocity and acceleration. Graphs can visually describe relationships. Graphs of Motion. Speed-Versus-Time.


MOTION GRAPHS
E N D
Presentation Transcript
Integrated Physics and Chemistry MOTION GRAPHS
Graphs of Motion Equations and tables are not the only way to describe relationships such as velocity and acceleration. Graphs can visually describe relationships.
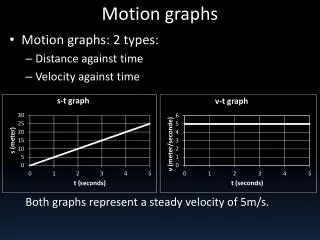
Graphs of Motion Speed-Versus-Time On a speed-versus-time graph, the speed ,v ,of a freely falling object can be plotted on the vertical axis and time t on the horizontal axis.
Graphs of Motion • The “curve” that best fits the points forms a straight line. • For every increase of 1 s, there is the same 9.8 m/s increase in speed. • Mathematicians call this linearity. • Since the object is dropped from rest, the line starts at the origin, where both v and t are zero. • If we double t, we double v; if we triple t, we triple v; and so on. • What kind of relationship is v and t? • What are v and t?
Graphs of Motion • This particular linearity is called a direct proportion, and we say that time and speed are directly proportional to each other.
Graphs of Motion The curve is a straight line, so its slope is constant. Slope is the vertical change divided by the horizontal change for any part of the line. Slope = ∆ y/∆x = y2-y1/ x2-x1
4.7Graphs of Motion For 9.8 m/s of vertical change there is a horizontal change of 1 s. The slope is 9.8 m/s divided by 1 s, or 9.8 m/s2. The straight line shows the acceleration is constant. If the acceleration were greater, the slope of the graph would be steeper.
Graphs of Motion Distance-Versus-Time When the distance dtraveled by a freely falling object is plotted on the vertical axis and time ton the horizontal axis, the result is a curved line. What else do we called the slope of distance over time?
Graphs of Motion This distance-versus-time graph is parabolic.
4.7Graphs of Motion A curved line also has a slope—different at different points. The slope of a curve changes from one point to the next. The slope of the curve on a distance-versus-time graph is speed, the rate at which distance is covered per unit of time. The slope steepens (becomes greater) as time passes, which shows that speed increases as time passes.
4.7Graphs of Motion What does a slope of a speed-versus-time graph represent?