Download
1 / 44
450 likes | 601 Views
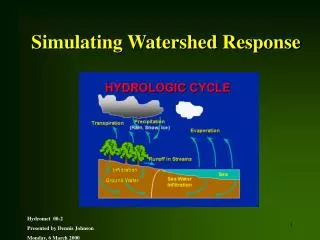
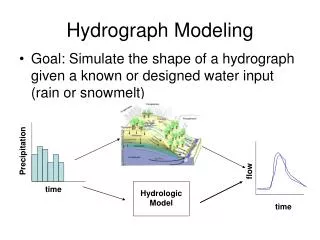
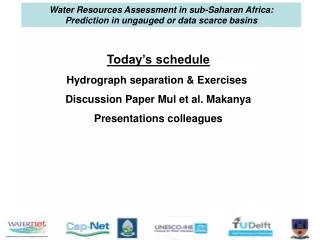
Today’s schedule Hydrograph separation & Exercises Discussion Paper Mul et al. Makanya Presentations colleagues. Hydrograph separation:

E N D
Today’s schedule Hydrograph separation & Exercises Discussion Paper Mul et al. Makanya Presentations colleagues
Hydrograph separation: Objective: After this day, all participants have good understanding of discharge generation processes and skills in hydrograph separation techniques. The participants are familiar with the advantages and disadvantages of this technique. Furthermore, the participants can plan short field campaigns in order to add valuable information about the hydrological behaviour of a study region.
Description of hydrograph shape Descriptive parameters: What do you think is important to know of a hydrograph?
Exercise: catchment characteristics - hydrographs Steeper catchment Less rough catchment Lesser storage capacity More connections between impervious areas
So…. The hydrograph gives information of hydrological processes in catchment But how do we separate a hydrograph?
The amount of water in storage is: Reversed proof All groundwater in storage at a certain time t is equal to all discharge between time t and infinite. That is also equal to the groundwater volume in the graph. STEP 1 Hydrograph separation: base flow recession Linear Reservoir S = k* Q
Hydrograph separation: base flow recession Linear Reservoir Qdir STEP 2: Determine direct flow
Hydrograph separation: terminology • How do we separate ‘fast’ and ‘slow’? • With process names (white box) • Surface runoff, interflow, groundwater flow • Time based (black box) • Quick/Fast flow - slow flow • Direct flow – base flow PRIORITY • What is direct flow (direct discharge)? • That part that we separate from the hydrograph • That part of the discharge that is the result from excess rainfall
Why the erroneous use of process names for the “non-base flow, the rain induced flow, the flood flow……” ? • Quick/Direct flow is conceptually seen as the result of: • Hortonian Overland Flow • Saturated (or Dunne) Overland Flow
Precipitation Overland flow (Horton) Subsurface flow Groundwater flow
Precipitation Overland flow (Horton) Seepage flow (Return flow) Groundwater flow
Variable source areas, partial area concept Variable sources: that part of a catchment that contributes to fast discharge (fast runoff) Sources: SOF, RF, SSSF, CP
What is the relevance of all this? Water storage in relation to floods/droughts There still is a need to study discharge generation processes in catchments….. … and be able to quantify them on process scale
Hydrograph separation So…, back to the techniques again Engineering approach (“Graphical method”) Fast/Quick - Slow Direct - base Separation of slow and fast water using linear reservoir assumption for baseflow (~groundwater) black box and lumped
Hydrograph separation Engineering approach continued a = constant slope method = straight line method (sometimes horizontal line) b = fixed base method = concave method c = variable slope method
Hydrograph separation Time based separation: Old-New Environmental isotopes Sklash & Farvolden, 1979: The role of ground- water in storm runoff. WRR. The bench mark paper:
event water (from: Mc Donnell, 2003) Pre-event water Event (new) and pre-event (old) water!
Pre-storm Pre-storm Hydrograph separation Time based separation: Old-New Environmental isotopes
Hydrograph separation Example Canada. Note the temporal variation in isotopic values of rain!
Hydrograph separation Geographic-Source separation: Rain-soil-groundwater Hydrochemical (or isotopic) information Tracing origin of stream water by using the chemical signature of different water sources within a catchment and quantifying the fluxes on basis of mass balance equations white box and lumped
Geographic-Source separation: The basic idea
Hydrograph separation using tracers Source separation: End-Member Mixing
Hydrograph separation “Subsurface” water dominates discharge Two-component hydrograph separation using 18O Total runoff QT, event water QE, and pre-event water QP Three-component hydrograph separation total runoff QT, surface runoff QS, shallow ground water QU, and deep ground water QL Uhlenbrook and Hoeg, 2003
3 Different Ways to Separate a Hydrograph Discharge onlyDischarge and tracers Class. engineeringapproach Environmental isotope approach Hydro-chemical approach Qoverland Qnew discharge (m3/s) discharge (m3/s) Qquick discharge (m3/s) time (h) time (h) time (h) Qsub-surface Qold Qslow ‘Runoff dynamics’ ‘Water age’ ‘Runoff source areas (origin)’
Hydrograph separation: Assumptions • Engineering approach: • Concept of linear reservoir approach for base flow is valid • Time based separation - Source based separation • Temporal and spatial variation of isotope concentration is known • Stable end-members for source based separation • Conservative tracers • Only advective transport, no lateral diffusion/dispersion
Objectives: Awareness of water flow paths in catchment hydrology Knowledge on tracer techniques, their applications and their limitations
Today’s schedule Hydrograph separation & Exercises Discussion Paper Mul et al. Makanya Presentations colleagues
100 80 50 60 20 50 mg/l 10 Discharge station Q=100 [l/s] Hydrograph separation & Exercises Constant input discharge mixing Q1*c1 + Q2*c2 = (Q1+Q2)*c3 Question 1: Proof that Q1 = (c3-c2)/(c1-c2) * Q3 Question 2: Calculate discharges along channel Chloride concentrations mg/l
Question 1 Mathematical derivation of dilution formula Q1 = Discharge upstream in tributary 1 [m3/s], Q2 = Discharge upstream in tributary 2 [m3/s] Q3 = Discharge downstream of the junction (sum of Q1 and Q2) [m3/s] c1, c2 and c3 are the concentrations of a conservative element like chloride in tributary 1 and 2 and downstream of the junction (3). [Kg/m3] The mass balance is: Q1 + Q2 = Q3 or Q2 = Q3 - Q1 and Q1*c1 + Q2*c2 = Q3*c3 Combining these two gives: Q1*c1 = Q3*c3 – (Q3-Q1)*c2 This can be re-arranged to: Q1*c1 = Q3*c3 – Q3*c2 +Q1*c2 Q1*(c1-c2) = Q3*(c3 –c2) Q1 = (c3-c2)/(c1-c2) * Q3 Assume Q3 to be 100 % gives the relative contribution of one tributary. Q2 logically follows: Q2 = 100% - Q1
100 80 50 60 20 50 mg/l 10 Discharge station Q=100 [l/s] Hydrograph separation & Exercises Constant input discharge mixing Q1*c1 + Q2*c2 = (Q1+Q2)*c3 32 l/s Question 2: Calculate discharges along channel 53 l/s 21 l/s 80 l/s 100 l/s 27 l/s 20 l/s Chloride concentrations mg/l
Discharge routing example Ijen volcano, east Java, Indonesia Bogaard, 2006
Surface water / groundwater systems analysis in the semi-arid South-Pare Mountains, Tanzania Marloes L. Mul1,2, Stefan Uhlenbrook1*, Robert K. Mutiibwa1, Jan Willem Foppen1, Hubert H.G. Savenije1,3 1 UNESCO-IHE, Institute for Water Education, PO Box 3015 DA, Delft, the Netherlands, m.mul@unesco-ihe.org 2 University of Zimbabwe, Department of Civil Engineering, PO Box MP167, Mount Pleasant, Harare, Zimbabwe 3 Delft University of Technology, Department of Water Resources, PO Box 5048, 2600 GA Delft, the Netherlands
Discussion Paper Mul et al. Makanya The objective of this paper is to give a brief overview about recent experimental investigations of runoff generation processes in the semi-arid Makanya catchment. The results of the experimental studies will form the basis for process-oriented modeling of water quantities and water quality in the future.
P(Vudee) = 13.5 mm day-1 P(Ndola) = 7.9 mm day-1 Qt = Total Discharge Qv = Upper Vudee (14.2 km2) Disch. Qn = Ndola (8.4 km2) Discharge P(Vudee) = 7 mm day-1 P(Ndola) = 17.6 mm day-1 Remark!!! - No suspended sediment - [Tracer] ≥ 90% [tracert=t0] - [Si]-based separation
Shengena/ Mbaga Bangalala Vudee Kisiwani SynthesisGroundwater Flow Systems in the Makanya Catchment
Conclusions Paper Mul et al. Makanya The experimental investigations show that highlands receive generally more rainfall than the lowlands, but that the space-time pattern during specific events can be very heterogeneous. The differences in precipitation are reflected in the extent /degree of weathering exhibited by the water in each of sub-catchments. The rainfall-runoff relationships showed differences for the two sub-catchments of Vudee and Ndolwa. However, flood generation is dominated by sub-surface processes during small event in both catchments. During the large event, significant amounts of surface runoff were generated, and the gauging stations were destroyed. Irrespective of the occurrences of isolated water points that have water quality associated with deep groundwater systems, it was demonstrated that only local flow systems with the main aquifer/storage being the unconsolidated “debris-flow” material exist in the study area. The geology has a big influence on the groundwater flow systems, the study area is loosing water to the neighbouring catchments of Mbaga and Kisiwani.