Download
1 / 1
10 likes | 103 Views
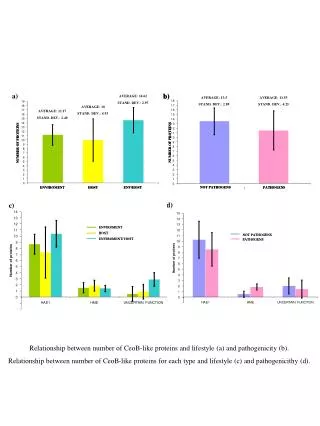
Explore the relationship between the number of CeoB-like proteins and lifestyle/pathogenicity in various environments and hosts. Analyze how the protein count impacts pathogenic traits.

E N D
a) b) b) AVERAGE: 14.62 AVERAGE: 10 AVERAGE: 13.5 AVERAGE: 11.53 STAND. DEV.: 2.97 STAND. DEV.: 4.93 STAND. DEV.: 2.89 STAND. DEV.: 4.25 AVERAGE: 11.17 STAND. DEV.: 2.40 NUMBER OF PROTEINS NUMBER OF PROTEINS NUMBER OF PROTEINS NUMBER OF PROTEINS NOT PATHOGENS NOT PATHOGENS PATHOGENS PATHOGENS ENVIROMENT ENVIROMENT HOST HOST ENV/HOST ENV/HOST d) c) ENVIROMENT ENVIROMENT HOST HOST NOT PATHOGENS NOT PATHOGENS ENVIROMENT/ HOST ENVIROMENT/ HOST PATHOGENS PATHOGENS Relationship between number of CeoB-like proteins and lifestyle (a) and pathogenicity (b). Relationship between number of CeoB-like proteins for each type and lifestyle (c) and pathogenicithy (d).