Download
1 / 5
50 likes | 211 Views
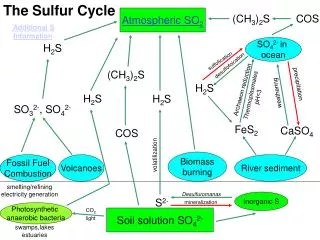
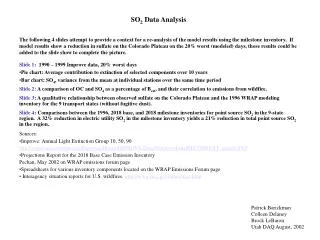
These slides present a re-analysis of model results utilizing the milestone inventory data. They showcase comparisons, charts on sulfate variance, correlations with emissions from wildfire, and more to enhance comprehension of the sulfate levels on the Colorado Plateau. The reduction in sulfate on the 20% worst days is examined in various contexts to provide a comprehensive view of visibility degradation components. The comparison of base and milestone inventories highlights reductions in point source SO2 emissions. Sources from multiple studies and agencies are referenced for further insight.

E N D
SO2 Data Analysis • The following 4 slides attempt to provide a context for a re-analysis of the model results using the milestone inventory. If model results show a reduction in sulfate on the Colorado Plateau on the 20% worst (modeled) days, those results could be added to the slide show to complete the picture. • Slide 1: 1990 – 1999 Improve data, 20% worst days • Pie chart: Average contribution to extinction of selected components over 10 years • Bar chart: SO4, variance from the mean at individual stations over the same time period • Slide 2: A comparison of OC and SO4 as a percentage of Bext, and their correlation to emissions from wildfire. • Slide 3: A qualitative relationship between observed sulfate on the Colorado Plateau and the 1996 WRAP modeling inventory for the 9 transport states (without fugitive dust). • Slide 4: Comparisons between the 1996, 2018 base, and 2018 milestone inventories for point source SO2 inthe 9-state region. A 32% reduction in electric utility SO2 in the milestone inventory yields a 21% reduction in total point source SO2 in the region. • Sources: • Improve: Annual Light Extinction Group 10, 50, 90 • http://vista.cira.colostate.edu/DatawareHouse/IMPROVE/Data/SummaryData/RECONBEXT_annual.TXT • Projections Report for the 2018 Base Case Emission Inventory • Pechan, May 2002 on WRAP emissions forum page • Spreadsheets for various inventory components located on the WRAP Emissions Forum page • Interagency situation reports for U.S. wildfires. http://www.nifc.gov/news/nicc.html Patrick Barickman Colleen Delaney Brock LeBaron Utah DAQ August, 2002
Components of Visibility Degradation on the Colorado Plateau 1989 – 1999 as Measured at 6 Locations ( 20% Worst Days ) Variation in Sulfate Contribution to Visibility Degradation During the 20% Worst Days 1989 - 1999
SO4 OC Correlation between wildfire intensity and the SO4/OC contribution to Bext on the Colorado Plateau.
Components of Visibility Degradation on the Colorado Plateau 1989 – 1999 as Measured at 6 Locations ( 20% Worst Days ) 1996 Inventory - 9 Transport States, All Sources 1996 SO2 Inventory
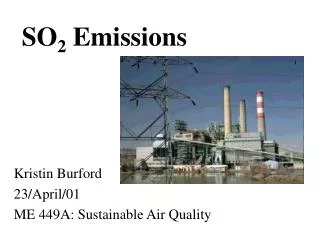
Point Source SO2 – 1996, 2018 Base Year, 2018 Milestone 17% Reduction in Point Source SO2 From 1996 to 2018 Base Year 21% reductionin Point Source SO2 From the 2018 Base Year to the 2018 Milestone Inventory Reduction in Electric Utility SO2 = 32%