Download
1 / 5
90 likes | 292 Views
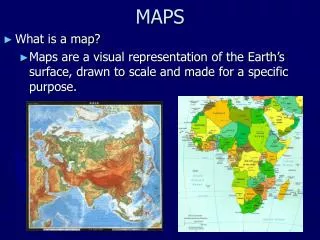
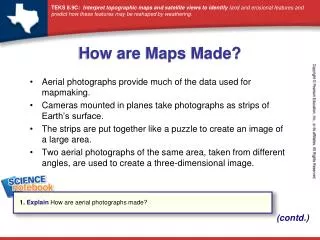
How are Maps Made?. Aerial photographs provide much of the data used for mapmaking. Cameras mounted in planes take photographs as strips of Earth’s surface. The strips are put together like a puzzle to create an image of a large area.

E N D
How are Maps Made? • Aerial photographs provide much of the data used for mapmaking. • Cameras mounted in planes take photographs as strips of Earth’s surface. • The strips are put together like a puzzle to create an image of a large area. • Two aerial photographs of the same area, taken from different angles, are used to create a three-dimensional image. 1. Explain How are aerial photographs made? (contd.)
How are Maps Made? • Satellite images are also used to make maps. • Mapping satellites use electronic devices to collect data about the land surface. • Computers use the satellite data to make images. The images are made of pixels, each of which contains information about the color and brightness of a part of Earth’s surface. • Earth’s surface is shown in different colors, depending on the ground cover. Vegetation are often shown as red or green, water as black or blue, and cities as bluish-gray. 2. Describe What would the area around your school look like on a satellite image?
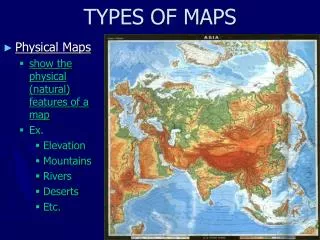
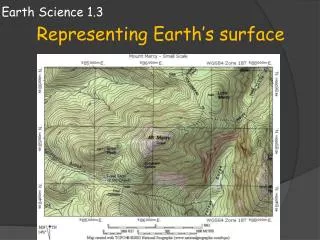
How do Maps Show Topography? • A topographic map shows the three dimensional features of an area. • A contour line is a line that connects points of equal elevation. • A contour interval is the change in elevation from one contour line to the next. It is always the same for a given map. 3. Define What is a contour line? (contd.)
How do Maps Show Topography? • Thin brown lines represent contours. • Closely spaced contour lines indicate steep slopes. • Widely spaced contour lines indicate gentle slopes or relatively flat areas. • A contour line that forms a closed loop with no other contour lines inside indicates a hilltop. • Contour lines form “V” shapes in streams. The closed end of the “V” points upstream. 4. Explain What would the contour lines look like for a canyon?