Download
1 / 30
300 likes | 375 Views
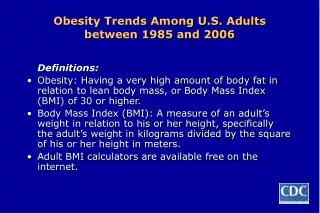
Obesity Trends Among U.S. Adults between 1985 and 2009.

E N D
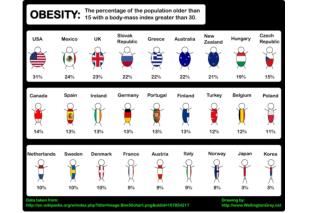
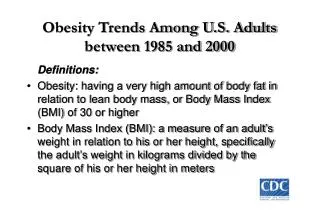
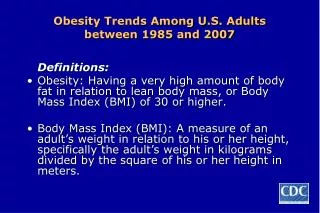
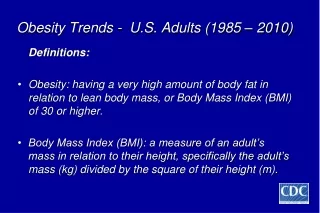
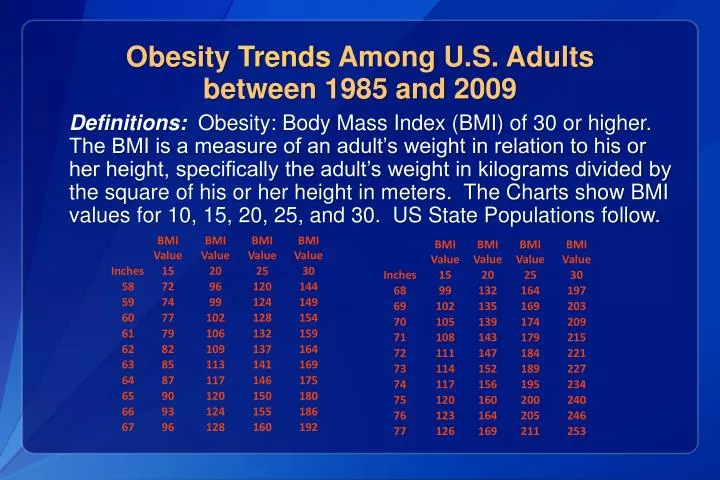
Obesity Trends Among U.S. Adults between 1985 and 2009 • Definitions: Obesity: Body Mass Index (BMI) of 30 or higher. The BMI is a measure of an adult’s weight in relation to his or her height, specifically the adult’s weight in kilograms divided by the square of his or her height in meters. The Charts show BMI values for 10, 15, 20, 25, and 30. US State Populations follow.
Obesity Trends Among U.S. Adults between 1985 and 2009 • Source of the data: • The data shown in these maps were collected through CDC’s Behavioral Risk Factor Surveillance System (BRFSS). Each year, state health departments use standard procedures to collect data through a series of telephone interviews with U.S. adults. • Prevalence estimates generated for the maps may vary slightly from those generated for the states by BRFSS (http://aps.nccd.cdc.gov/brfss) as slightly different analytic methods are used.
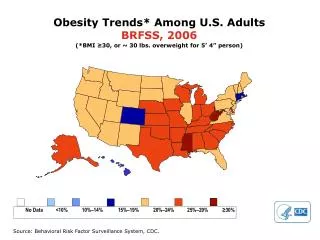
In 1990, among states participating in the Behavioral Risk Factor Surveillance System, ten states had a prevalence of obesity less than 10% and no states had prevalence equal to or greater than 15%. • By 1999, no state had prevalence less than 10%, eighteen states had a prevalence of obesity between 20-24%, and no state had prevalence equal to or greater than 25%. • In 2009, only one state (Colorado) and the District of Columbia had a prevalence of obesity less than 20%. Thirty-three states had a prevalence equal to or greater than 25%; nine of these states (Alabama, Arkansas, Kentucky, Louisiana, Mississippi, Missouri, Oklahoma, Tennessee, and West Virginia) had a prevalence of obesity equal to or greater than 30%.
Citations • BRFSS, Behavioral Risk Factor Surveillance System http: //www.cdc.gov/brfss/ • Mokdad AH, et al. The spread of the obesity epidemic in the United States, 1991—1998 JAMA 1999; 282:16:1519–22. • Mokdad AH, et al. The continuing epidemics of obesity and diabetes in the United States. JAMA. 2001; 286:10:1519–22. • Mokdad AH, et al. Prevalence of obesity, diabetes, and obesity-related health risk factors, 2001. JAMA 2003: 289:1: 76–9 • Vital Signs: State-Specific Obesity Prevalence Among Adults —United States, 2009 MMWR 2010;59(30).
Obesity Trends* Among U.S. AdultsBRFSS,1990, 1999, 2009 (*BMI 30, or about 30 lbs. overweight for 5’4” person) 1999 1990 2009 No Data <10% 10%–14% 15%–19% 20%–24% 25%–29% ≥30%
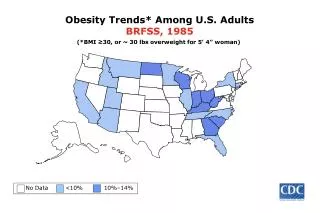
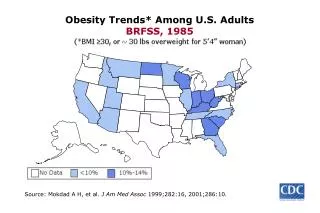
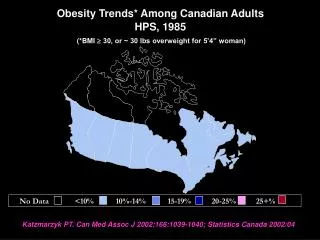
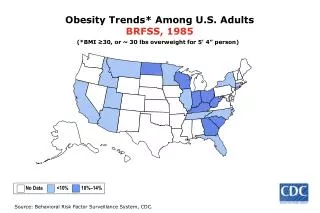
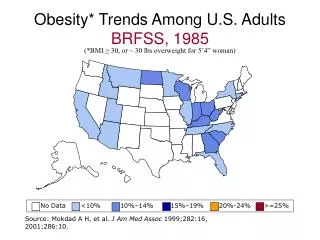
Obesity Trends* Among U.S. AdultsBRFSS, 1985 (*BMI ≥30, or ~ 30 lbs. overweight for 5’ 4” person) No Data <10% 10%–14%
Obesity Trends* Among U.S. AdultsBRFSS, 1986 (*BMI ≥30, or ~ 30 lbs. overweight for 5’ 4” person) No Data <10% 10%–14%
Obesity Trends* Among U.S. AdultsBRFSS, 1987 (*BMI ≥30, or ~ 30 lbs. overweight for 5’ 4” person) No Data <10% 10%–14%
Obesity Trends* Among U.S. AdultsBRFSS, 1988 (*BMI ≥30, or ~ 30 lbs. overweight for 5’ 4” person) No Data <10% 10%–14%
Obesity Trends* Among U.S. AdultsBRFSS, 1989 (*BMI ≥30, or ~ 30 lbs. overweight for 5’ 4” person) No Data <10% 10%–14%
Obesity Trends* Among U.S. AdultsBRFSS, 1990 (*BMI ≥30, or ~ 30 lbs. overweight for 5’ 4” person) No Data <10% 10%–14%
Obesity Trends* Among U.S. AdultsBRFSS, 1991 (*BMI ≥30, or ~ 30 lbs. overweight for 5’ 4” person) No Data <10% 10%–14% 15%–19%
Obesity Trends* Among U.S. AdultsBRFSS, 1992 (*BMI ≥30, or ~ 30 lbs. overweight for 5’ 4” person) No Data <10% 10%–14% 15%–19%
Obesity Trends* Among U.S. AdultsBRFSS, 1993 (*BMI ≥30, or ~ 30 lbs. overweight for 5’ 4” person) No Data <10% 10%–14% 15%–19%
Obesity Trends* Among U.S. AdultsBRFSS, 1994 (*BMI ≥30, or ~ 30 lbs. overweight for 5’ 4” person) No Data <10% 10%–14% 15%–19%
Obesity Trends* Among U.S. AdultsBRFSS, 1995 (*BMI ≥30, or ~ 30 lbs. overweight for 5’ 4” person) No Data <10% 10%–14% 15%–19%
Obesity Trends* Among U.S. AdultsBRFSS, 1996 (*BMI ≥30, or ~ 30 lbs. overweight for 5’ 4” person) No Data <10% 10%–14% 15%–19%
Obesity Trends* Among U.S. AdultsBRFSS, 1997 (*BMI ≥30, or ~ 30 lbs. overweight for 5’ 4” person) No Data <10% 10%–14% 15%–19% ≥20%
Obesity Trends* Among U.S. AdultsBRFSS, 1998 (*BMI ≥30, or ~ 30 lbs. overweight for 5’ 4” person) No Data <10% 10%–14% 15%–19% ≥20%
Obesity Trends* Among U.S. AdultsBRFSS, 1999 (*BMI ≥30, or ~ 30 lbs. overweight for 5’ 4” person) No Data <10% 10%–14% 15%–19% ≥20%
Obesity Trends* Among U.S. AdultsBRFSS, 2000 (*BMI ≥30, or ~ 30 lbs. overweight for 5’ 4” person) No Data <10% 10%–14% 15%–19% ≥20%
Obesity Trends* Among U.S. AdultsBRFSS, 2001 (*BMI ≥30, or ~ 30 lbs. overweight for 5’ 4” person) No Data <10% 10%–14% 15%–19% 20%–24% ≥25%
Obesity Trends* Among U.S. AdultsBRFSS, 2002 (*BMI ≥30, or ~ 30 lbs. overweight for 5’ 4” person) No Data <10% 10%–14% 15%–19% 20%–24% ≥25%
Obesity Trends* Among U.S. AdultsBRFSS, 2003 (*BMI ≥30, or ~ 30 lbs. overweight for 5’ 4” person) No Data <10% 10%–14% 15%–19% 20%–24% ≥25%
Obesity Trends* Among U.S. AdultsBRFSS, 2004 (*BMI ≥30, or ~ 30 lbs. overweight for 5’ 4” person) No Data <10% 10%–14% 15%–19% 20%–24% ≥25%
Obesity Trends* Among U.S. AdultsBRFSS, 2005 (*BMI ≥30, or ~ 30 lbs. overweight for 5’ 4” person) No Data <10% 10%–14% 15%–19% 20%–24% 25%–29% ≥30%
Obesity Trends* Among U.S. AdultsBRFSS, 2006 (*BMI ≥30, or ~ 30 lbs. overweight for 5’ 4” person) No Data <10% 10%–14% 15%–19% 20%–24% 25%–29% ≥30%
Obesity Trends* Among U.S. AdultsBRFSS, 2007 (*BMI ≥30, or ~ 30 lbs. overweight for 5’ 4” person) No Data <10% 10%–14% 15%–19% 20%–24% 25%–29% ≥30%
Obesity Trends* Among U.S. AdultsBRFSS, 2008 (*BMI ≥30, or ~ 30 lbs. overweight for 5’ 4” person) No Data <10% 10%–14% 15%–19% 20%–24% 25%–29% ≥30%
Obesity Trends* Among U.S. AdultsBRFSS, 2009 (*BMI ≥30, or ~ 30 lbs. overweight for 5’ 4” person) No Data <10% 10%–14% 15%–19% 20%–24% 25%–29% ≥30%