Download

1 / 26
260 likes | 391 Views
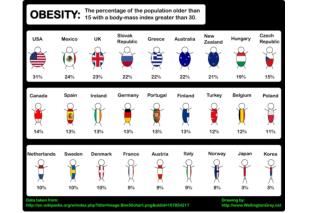
Obesity in the U.S. Prevalence and Trends. Pennington Biomedical Research Center Division of Education. Obesity in the U.S. Current Trends. Currently, about 66% of American adults are overweight and about 32% are obese.

E N D
Obesity in the U.S.Prevalence and Trends Pennington Biomedical Research Center Division of Education
Obesity in the U.S.Current Trends • Currently, about 66% of American adults are overweight and about 32% are obese. • The obesity weight class has increased the most over the past few decades. • Compared with prevalence rates reported in 1976-80, the rates of obesity seen today are more than double what they were only thirty years ago.
Overweight is Rising This overweight classification combines those who are classified as overweight (BMI 25-29.9) and those who are obese (BMI ≥ 30). 66.3 65.7 64.5 56.0 Adapted from: the Centers for Disease Control and Prevention (CDC)
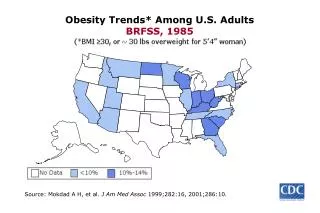
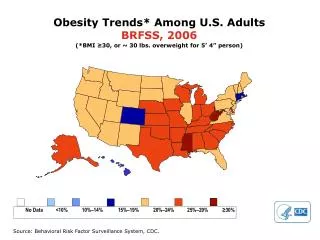
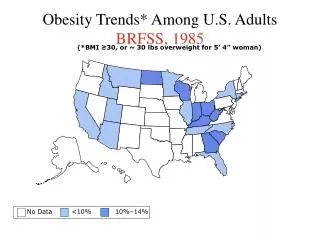
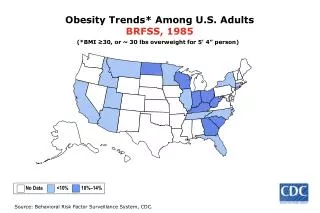
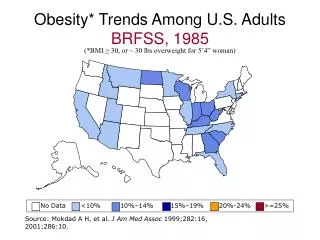
1991 Obesity Continues to Rise Trends in the United States Obesity is defined as having a BMI ≥ 30 1996 2004 Prevalence of obesity by state No Data <10% 10%–14% 15%–19% 20%–24% ≥25% Source: Behavioral Risk Factor Surveillance System, CDC
Obesity • An estimated 66 million adults in the United States are obese. • Being either overweight or obese substantially raises one’s risk of morbidity from: • Hypertension • Dyslipidemia • Type 2 diabetes • Coronary heart disease • Stroke • Gallbladder disease • Osteoarthritis • Sleep apnea and respiratory problems • Endometrial, breast, prostate, and colon cancers.
ObesityIntroduction • In addition to the increased risk for several diseases, higher body weights are also associated with increases in all-cause mortality. • An estimated 300,000 deaths per year are attributable to obesity. • As the second leading cause of preventable death in the United States today, overweight and obesity pose a major public health threat.
Obesity in the U.S.Race/Ethnic • The picture is even worse when rates are looked at by gender and ethnic backgrounds: • 77 percent of Black women are overweight, and 50 percent are obese, while • 72 percent of Mexican-American women are overweight, and 40 percent of Mexican American women are obese. Significant differences in obesity exist among different racial or ethnic groups CDC/NCHS; Flegal KM 2002
Obesity in the U.S.Socioeconomic Status • A Dutch study found a link between socioeconomic status (SES) and obesity. • In fact, those in the very low SES had the highest rates of obesityand consumed the most soft drinks, potatoes, fat, and meat. • A long term study found that African American women had higher rates of obesity than Caucasian regardless of SES. Hulshof KFAM et al. 2003; Zhang and Wang 2004; Johnson-Down et al 1997
Obesity in the U.S.Socioeconomic Status Higher socioeconomic group women: • Diet more often • Have greater access to resources • Have better nutrition knowledge • Are committed to slimness • Avoid high fat foods • Get more physical activity
In Developing CountriesObesity & SES Higher socioeconomic group women: • Have more incidence of obesity • Have less malnutrition • Have less infection • Have a steady source of income and food In fact, overweight is associated with wealth
Obesity in the U.S.What is the Cost? • According to a study of national costs attributed to both overweight and obesity, medical expenses accounted for 9.1% of the total U.S. medical expenditures in 1998. • Medical expenses for overweight and obesity may have reached as high as $78.5 billion in 1998. • In Louisiana alone, approximately $1.4 billion was spent on overweight and obesity-related medical expenses.
ObesityWhat are the Causes? • Overweight and obesity are the result of an energy imbalance over a long period of time. • While the whole picture is still unclear on how obesity develops, it is believed to involve the integration of social, behavioral, cultural, physiological, metabolic, and genetic factors. • Behavior and environmentappear to play a large role the development of obesity, and are often the focus for prevention and treatment actions.
Energy ImbalanceWhat is it? • Energy balance is like a scale where both sides are of equal weight. • An energy imbalance arises when the number of calories consumed is not equal to the number of calories used by the body. • Weight gain usually involves the combination of consuming too many calories and not expending enough enough through physical activity, although weight gain could result from one or the other. Weight Gain Calories Consumed > Calories Used Weight Loss Calories Consumed < Calories Used No Weight Change Calories Consumed = Calories Used CDC
ObesityDiet and Exercise • Physical activity contributes to weight loss, especially when combined with a calorie reduction. • Physical activity is important in preventing overweight and obesity and in maintaining weight that is lost. • In addition to weight control, physical activity helps: • Prevent heart disease • Control cholesterol levels and diabetes • To slow bone loss associated with advancing age • Lower the risk of certain cancers • Reduce anxiety and depression
Body Mass IndexIndicator of Weight Status • Body mass index (BMI) is a mathematical ratio taking into account an individual’s weight, in kilograms, and height, in meters squared (kg/m2). This measure can be used for adults 20 years of age and older. • BMI determines an individuals weight category. You can find tables on the web that that are ready-made for you. http://www.nhlbisupport.com/bmi
Obesity Classes • Class 1 • BMI of 30-35 • Class 2 • BMI of 35-40 • Class 3, Extreme obesity • BMI greater than 40
Waist Circumference • Waist circumference is a predictor of mortality and chronic disease. • It is a prognostic indicator along with BMI. • The presence of excess body fat in the abdomen, when out of proportion to total body fat, is considered an independent predictor of risk factors and ailments associated with obesity. Men = Greater than 40 inches Women = Greater than 35 inches
Waist Circumference & BMIAnd Disease Risk Disease Risk * Relative to Normal Weight and Waist Circumference * Disease risk for type 2 diabetes, hypertension, and cardiovascular disease Adapted from: Clinical guidelines on the identification, evaluation, and treatment of overweight and obesity in adults
Why is a BMI of 20-25 considered as a reference weight? This is because the relationship between morbidity and mortality and BMI is minimal at that range. Increased risk Body Mass Index
Body Mass Index • It is important to remember that although BMI correlates with the amount of body fat a person has, it does not directly measure body fat. • However, with the exception of highly trained athletes, BMI is a good predictor of chronic disease and mortality in individuals.
In Summary… • The prevalence of overweight and obesity in the U.S. is higher than ever before. • BMI & waist circumference are correlated with body fat and can predict the risk for disease. • Being overweight or obese substantially raises one’s risk of morbidity from many diseases. • Significant differences exist in obesity among different racial or ethnic groups. • Diet and physical activity are important in the fight against obesity.
Pennington Biomedical Research Center Division of Education • Heli J. Roy, PhD, RD, Associate Professor • Shanna Lundy, BS • Beth Kalicki • Division of EducationPhillip Brantley, PhD, DirectorPennington Biomedical Research CenterClaude Bouchard, PhD, Executive Director Edited: October 2009
About Our Company • The Pennington Biomedical Research Center is a world-renowned nutrition research center. • Mission: • To promote healthier lives through research and education in nutrition and preventive medicine. • The Pennington Center has several research areas, including: • Clinical Obesity Research • Experimental Obesity • Functional Foods • Health and Performance Enhancement • Nutrition and Chronic Diseases • Nutrition and the Brain • Dementia, Alzheimer’s and healthy aging • Diet, exercise, weight loss and weight loss maintenance • The research fostered in these areas can have a profound impact on healthy living and on the prevention of common chronic diseases, such as heart disease, cancer, diabetes, hypertension and osteoporosis. • The Division of Education provides education and information to the scientific community and the public about research findings, training programs and research areas, and coordinates educational events for the public on various health issues. • We invite people of all ages and backgrounds to participate in the exciting research studies being conducted at the Pennington Center in Baton Rouge, Louisiana. If you would like to take part, visit the clinical trials web page at www.pbrc.edu or call (225) 763-3000.
Additional Resources: • MyPyramid: Food Pyramid. Available at: http://www.mypyramid.gov • Overweight and Obesity: Contributing Factors. Available at: http://www.cdc.gov/nccdphp/dnpa/obesity/contributing_factors.htm • Calculate your daily calorie needs. Available at: http://www.cancer.org/docroot/PED/content/PED_6_1x_Calorie_Calculator.asp • How many calories will your activity burn? Available at: http://www.cancer.org/docroot/PED/content/PED_6_1x_Exercise_Counts.asp?sitearea=&level
References • Centers for Disease Control and Prevention. Available at: http://www.cdc.gov • Clinical guidelines on the identification, evaluation, and treatment of overweight and obesity in adults. Available at: http://www.nhlbi.nih.gov/guidelines/obesity/ob_exsum.pdf • Obesity trends among U.S. adults. Available at: http://www.cdc.gov/nccdphp/dnpa/obesity/trend/maps/obesity_trends_2004.ppt • Johnson-Down L, O'Loughlin L, Koski KG, and Gray-Donald K. High Prevalence of Obesity in Low Income and Multiethnic Schoolchildren: A Diet and Physical Activity Assessment. The Journal of Nutrition Vol. 127 No. 12 December 1997, pp. 2310-2315.
References • Legal KM, Carroll MD, Ogden CL, Johnson CL. Prevalence and trends in obesity among US adults, 1999-2000 JAMA. 2002;288:1723-1727. • Zhang, Q and Wang Y. Trends in the association between obesity and socioeconomic status in US Adults: 1971-2000. Obesity Research 12:1622-1632, 2004. • Hulshof KF, Brussaard JH, Kruizinga AG, Telman J, Lowik MR. Socio-economic status, dietary intake and 10 y trends: the Dutch National Food Consumption Survey. Eur J Clin Nutr. 2003 Jan;57(1):128-37.