Download
1 / 9
90 likes | 185 Views
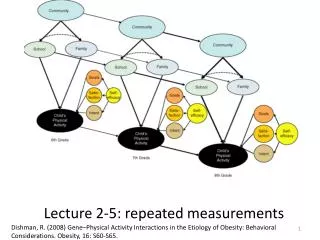
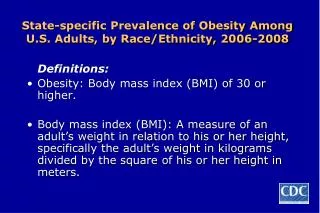
State-specific Prevalence of Obesity Among U.S. Adults, by Race/Ethnicity, 2006-2008. Definitions: Obesity: Body mass index (BMI) of 30 or higher.

E N D
State-specific Prevalence of Obesity Among U.S. Adults, by Race/Ethnicity, 2006-2008 • Definitions: • Obesity: Body mass index (BMI) of 30 or higher. • Body mass index (BMI): A measure of an adult’s weight in relation to his or her height, specifically the adult’s weight in kilograms divided by the square of his or her height in meters.
State-specific Prevalence of Obesity Among U.S. Adults, by Race/Ethnicity, 2006-2008 • Methods: • Behavioral Risk Factor Surveillance System (BRFSS). • Self-reported weights and heights. • Limited to three years of data and limited to three racial/ethnic populations; non-Hispanic whites, non-Hispanic blacks, and Hispanics. • Age-adjusted to the 2000 U.S. standard population.
State-specific Prevalence of Obesity* Among U.S. Adults, by Race/Ethnicity, 2006-2008 White non-Hispanic Black non-Hispanic Hispanic (*BMI 30)
State-specific Prevalence of Obesity* Among U.S. Adults, by Race/Ethnicity, 2006-2008 White non-Hispanic (*BMI 30)
State-specific Prevalence of Obesity* Among U.S. Adults, by Race/Ethnicity, 2006-2008 Black non-Hispanic (*BMI 30)
State-specific Prevalence of Obesity* Among U.S. Adults, by Race/Ethnicity, 2006-2008 Hispanic (*BMI 30)
Table. Prevalence of obesity, by region and race/ethnicity, 2006-2008
Summary • Non-Hispanic blacks had the highest prevalence, followed by Hispanics, and non-Hispanic whites • For non-Hispanic blacks • Overall prevalence of obesity—35.7% • Higher prevalences were found in the Midwest and South • Prevalence ranged from 23.0% (New Hampshire) to 45.1% (Maine) • 40 states had a prevalence of ≥ 30% • 5 states (Alabama, Maine, Mississippi, Ohio, and Oregon) had a prevalence of ≥ 40%
Summary (Cont’d) • For Hispanics • Overall prevalence of obesity—28.7% • Lower prevalence was observed in the Northeast • Prevalence ranged from 21.0% (Maryland) to 36.7% (Tennessee) • 11 states had a prevalence of ≥ 30% • For non-Hispanic whites • Overall prevalence of obesity—23.7% • Higher prevalences were found in the Midwest and South • Prevalence ranged from 9.0% (DC) to 30.2% (West Virginia) • Only one state (West Virginia) had a prevalence of ≥ 30% • 5 states (California, Colorado, Connecticut, Hawaii, and New Mexico) and DC had a prevalence of <20%