Download
1 / 40
400 likes | 622 Views
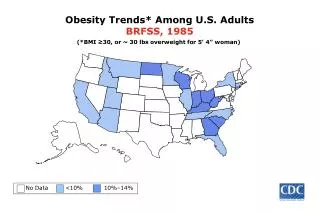
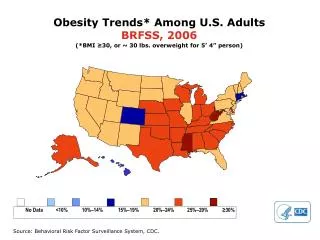
Obesity Trends* Among U.S. Adults BRFSS, 2006. (*BMI ≥30, or ~ 30 lbs. overweight for 5’ 4” person). No Data <10% 10%–14% 15%–19% 20%–24% 25%–29% ≥30%. Source: Behavioral Risk Factor Surveillance System, CDC.

E N D
Obesity Trends* Among U.S. AdultsBRFSS, 2006 (*BMI ≥30, or ~ 30 lbs. overweight for 5’ 4” person) No Data <10% 10%–14% 15%–19% 20%–24% 25%–29% ≥30% Source: Behavioral Risk Factor Surveillance System, CDC.
Obesity Trends* Among U.S. AdultsBRFSS, 2007 (*BMI ≥30, or ~ 30 lbs. overweight for 5’ 4” person) No Data <10% 10%–14% 15%–19% 20%–24% 25%–29% ≥30% Source: Behavioral Risk Factor Surveillance System, CDC.
Obesity Trends* Among U.S. AdultsBRFSS, 2008 (*BMI ≥30, or ~ 30 lbs. overweight for 5’ 4” person) No Data <10% 10%–14% 15%–19% 20%–24% 25%–29% ≥30% Source: Behavioral Risk Factor Surveillance System, CDC.
Obesity Trends* Among U.S. AdultsBRFSS, 2009 (*BMI ≥30, or ~ 30 lbs. overweight for 5’ 4” person) No Data <10% 10%–14% 15%–19% 20%–24% 25%–29% ≥30% Source: Behavioral Risk Factor Surveillance System, CDC.
Obesity Trends* Among U.S. AdultsBRFSS, 2010 (*BMI ≥30, or ~ 30 lbs. overweight for 5’ 4” person) No Data <10% 10%–14% 15%–19% 20%–24% 25%–29% ≥30% Source: Behavioral Risk Factor Surveillance System, CDC.
County-level Estimates of Diagnosed Diabetes among Adults aged ≥ 20 years: United States 2004 Percent www.cdc.gov/diabetes
County-level Estimates of Diagnosed Diabetes among Adults aged ≥ 20 years: United States 2005 Percent www.cdc.gov/diabetes
County-level Estimates of Diagnosed Diabetes among Adults aged ≥ 20 years: United States 2006 Percent www.cdc.gov/diabetes
County-level Estimates of Diagnosed Diabetes among Adults aged ≥ 20 years: United States 2007 Percent www.cdc.gov/diabetes
County-level Estimates of Diagnosed Diabetes among Adults aged ≥ 20 years: United States 2008 Percent www.cdc.gov/diabetes
Diabetes Type II • In 2011: 25.8 million children and adults had diabetes ( 8.3%) • Diagnosed: 18.8 million • Undiagnosed: 7.0 million • Pre-diabetes: 79 million! • New cases: 1.9 million new cases in 2010 • Age 20 or older - 11.3% • Age 65 or older- 26.9%
Diabetes- complication statistics • Diabetics have 2-4 times the incidence of heart disease • Diabetics have 2-4 times the incidence of stroke • Diabetes is the leading cause of blindness • Two-thirds of diabetics also have hypertension • Diabetes is the leading cause of kidney failure • Leading cause of non-traumatic limb amputations
Causes of Surprises • Newly found diabetes • Many undiagnosed diabetics discovered on insurance testing • Newly found Hepatitis • Six kinds of viral hepatitis: A,B,C etc • Hepatitis A: food borne, usually short illness, self limited • Hepatitis B & C are public health concerns
Hepatitis B • Endemic in many parts of the world e.g. SE Asia, China, India, Africa • Vaccination is available and routine in most countries • Most frequent cause of chronic active hepatitis (CAH) • CAH is the leading cause of hepatic carcinoma and cirrhosis • Diagnosis requires blood testing and many times liver biopsy • Treatment is available, response is variable • Pre-Core mutant is particularly dangerous
Hepatitis C • Used to be called non-A, non-B hepatitis • Three strains (1,2,3) with strain one being the most pathologic and most common • It’s symptoms can remain hidden for decades • Many exposures occurred prior to testing especially blood products • Since testing blood, most exposures are related to IV drug use or sexual contact • 75% of HCV are unaware they are infected
Hepatitis C • Feb 21, 2012 CDC study showed: • 3.2 million Americans infected, 170 million worldwide, most- undiagnosed • 1 in 33 baby boomers (born 1945-1965) are infected • in 2007 it surpassed HIV in number of deaths • “It is a silent epidemic” Dr John Ward, CDC hepatitis chief • Treatment is similar to Hepatitis B with interferon and anti-virals • Liver biopsy is essential to determine severity of disease; the extent of disease is not proportional to liver enzymes • 40% of incarcerated inmates are Hep C positive • It is a leading cause of liver failure, cirrhosis, and liver cancer • Hepatitis C is the leading cause for liver transplantation in the US
What information is useful for underwriting hepatitis • Is this a new finding or well studied? • What studies have been done? • Serology, viral loads, what strain? • How long ago? • liver biopsy - gold standard to establish degree of damage • Treatment given • The more information the better, underwriters typically do not assume the best case scenario
Surprises: Elevated liver enzymes • Diverse etiologies • Obesity - steatohepatitis • Alcohol • NSAIDs • Gallbladder disease • Hepatitis- infectious and non-infectious • Toxins
Elevated liver enzymes • Wilson’s disease - copper storage disease • Hemochromatosis - iron overload • Drugs- especially anti-seizure medications • Acute illnesses • Tumors • Pancreatic Disease
Surprises: HIV • See an occasional unexpected result • Many positive tests are never requested by applicant - “likely knew”
Electrocardiograms • For many, the insurance examination EKG is their first • Many electrical changes that occur in the heart (and on the EKG) have no symptoms • Many times the doctor does not discuss EKG findings with their patient • Obtaining a good quality, properly run EKG in the field can be a challenge
Other reasons for Surprises • Applicants don’t know what’s in their medical records • For example: “Mr Smith tells me that he is only drinking two beers a week but I find that very hard to believe. I estimate that he must be drinking at least a six-pack every day”. • Applicants don’t follow through with recommended tests: • For example: “Bob’s chest pain has several elements that are very worrisome for coronary artery disease. I have recommended that he undergo a stress thallium treadmill.” • Bob considered this a “suggestion that he could follow or not”. He elected “not”.
Other reasons for Surprises • Applicants hear a different story from their doctor • Bob hears: “You are doing great, keep up the good work!” • In reality: For an obese, hypertensive, diabetic who smokes and just had a heart attack you are doing great. • Wrong information in the chart • Patients mislead themselves about the state of their health
Why do applicants hear a different story from their personal doctor and insurance medical director? • Our “headlights” are set on different scales: • The average physician’s field of vision is at greatest 5 years ahead • The med director is projecting out perhaps many decades (age 85 or more) and has “one bite at the apple”. • Physician uses his experience and some clinical studies of limited duration • Med Director uses actuarial data
Why do applicants hear a different story from their personal doctor and insurance medical director? • Our “headlights” are set on different scales: • The average physician’s field of vision is at greatest 5 years ahead • The med director is projecting out perhaps many decades (age 85 or more) • Physician uses his experience and some clinical studies of limited duration • Med Director uses actuarial data • “Poker Chip Syndrome” • Typical phone conversation • Physician’s duty is to represent his patient and their best interests
Why do applicants hear a different story from their personal doctor and insurance medical director? • Survey published February 2012 issue of Health Affairs set off a round on controversy • 1,891 physicians across the country • Over fifty percent admitted describing a patient’s prognosis in a way “they knew was too rosy” • 20% said they hadn’t fully disclosed a medical mistake for fear of being sued • 1 in 10 admitted telling a patient something that wasn’t true in the past year.
Popular Myths on Aging • 100 year olds are growing rapidly • In 1990: 37,306 • In 2000: 50,454 • In 2010: 71,991 • The two week challenge • What is middle age • at what age does the roller coaster cross the summit? • Pro athletes and celebrities are great risks • Money buys good health • Money buys access to good health care
Why do different companies rate differently? • Example: • 45 year old man applies for $2.5 million in term life. He denies any previous medical history but his cholesterol is modestly elevated and his father died at age 55 from a heart attack. No medications. Slightly hypertensive on exam and a bit overweight. He smokes. • His electrocardiogram shows the following:
Why do different companies rate differently? • Example: • 45 year old man applies for $2.5 million in term life. He denies any previous medical history but his cholesterol is modestly elevated and his father died at age 55 from a heart attack. No medications. Slightly hypertensive on exam and a bit overweight. He smokes. • His electrocardiogram shows the following: • Based on his EKG we elected to make no offer but decided to send the case to 3 reinsurers. Each Reinsurer got exactly the same information.
Reinsurers’ Responses Reinsurer B Table H Reinsurer A Decline Reinsurer C Standard
How to explain? • different reinsurance reference manuals • Beauty is in the eye of the beholder!!
Conclusions: • We want to help you sell....If you don’t make money, we don’t make money! • Our goal is to make your job and your client’s underwriting process as convenient as possible but still gather the necessary information to underwrite properly. • Surprises do come up in the underwriting process mainly due to unanticipated medical history and lab results • Differences in underwriting offers can be hard to explain! • On Your Side is not just a slogan for Nationwide