Download
1 / 42
420 likes | 439 Views
Learn about causes, prediction, and impacts of droughts, their societal and economic consequences, and proactive approaches to handling them. Explore different drought indices, time scales, and monitoring techniques across the US.

E N D
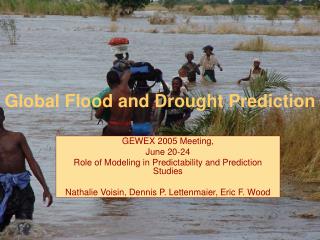
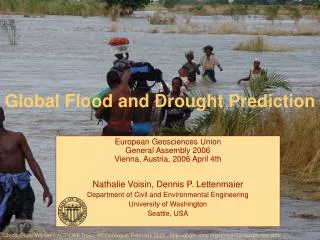
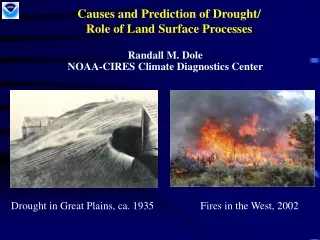
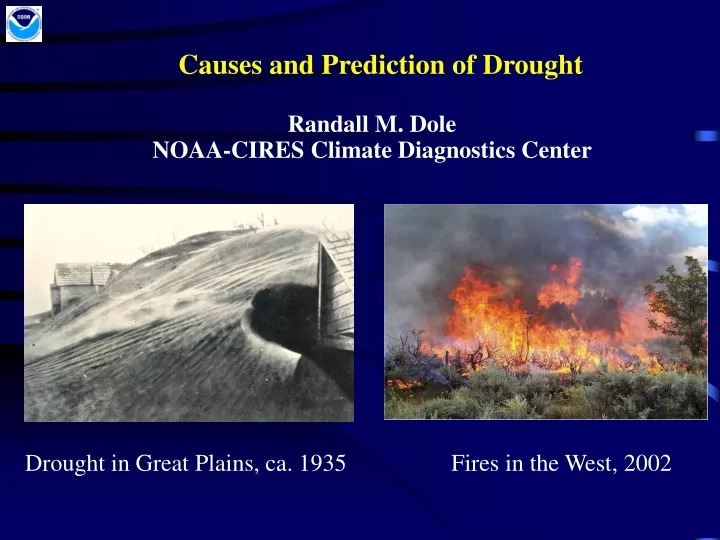
Drought Causes,Prediction Causes and Prediction of Drought Randall M. Dole NOAA-CIRES Climate Diagnostics Center Drought in Great Plains, ca. 1935 Fires in the West, 2002
Drought context Context: Importance of Drought North Platte river, May 22, 2002 Mean flow: 1310 cu. ft/sec Observed flow: 0 cu. ft/sec. • Droughts are not simply climate phenomena; they have profound societal, economic, and environmental consequences. • Traditional federal/state response to drought has been reactive. We are moving toward a more proactive approach - “National Drought Preparedness Act of 2003”. Implications for NOAA wx/climate services --
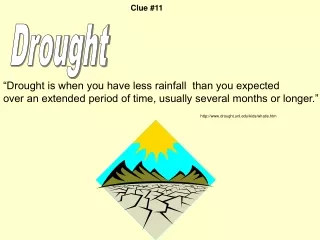
Drought characteristics - definitions and types Drought characteristics a. Definition(s) No unique definition. National Drought Policy Commission: “ a persistent and abnormalmoisture deficiency having adverse impacts on vegetation, animals, and people”. b. Types Meteorological - rainfall deficit (better: P - E ( supply-demand)) Agricultural - topsoil moisture deficit; crop impacts. Hydrological - surface or sub-surfacewater supply shortage. Typically, meteorological agricultural hydrological. Similar sequence for recovery. For more info, on defintions, see National Drought Mitigation Center website: http://www.drought.unl.edu/index.htm/ .
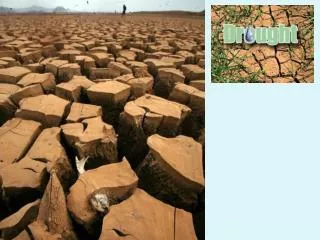
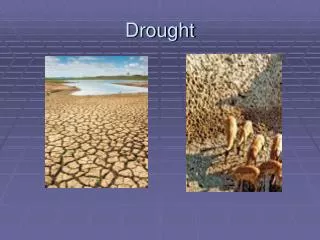
Drought time scales c. Time scales Droughts span a broad range of time scales, from short-term “flash droughts” that may have significant agricultural impacts, to multi-year or even decadal droughts (1930s, 1950s, etc.) Paleoclimate evidence suggests that in the last 1000 years parts of the U.S. have experienced “mega-droughts” that persisted for decades. Droughts
Drought Indices d. Drought indices Numerous drought measures - all have strengths and shortcomings. Some of the most common measures: • Percent of normal precipitation (problem: non-normal dist.) • Standardized precipitation index, or SPI (only considers P) • Crop Moisture Index, CMI - simple water balance, top layer • Palmer Drought Severity Index (PDSI) - responds slowly • Deciles or quintiles - lowest quintile “much below normal”, need fairly long, stable climate record.
SPI Examples - 2002 Case: Standardized Precipitation Index (June 2002)
SPI time series SPI local time history (created from WRCC website - 08/02) Standardized Precipitation Index Northern New Mexico Normal Drought Severe 1 2 3 4 5 6 Current Years before present
CMI Crop Moisture Index (CMI) - 2002 Case (from CPC - 24 August 2002) The CMI is most useful for short-term monitoring (e.g., for ag.)
PDSI Palmer Drought Severity Index - 2002 Case (from CPC - 24 August 2002) The PDSI is more useful for monitoring long-term, hydrological drought.
PDSI time series -area coverage PDSI- area coverage of severe drought Percent area under severe or worse drought in western US and for Contiguous US. Black curve based on 5-month running mean of monthly PDSI values. Red curve shows 5-year running mean values.
National Drought Monitor -2002 case represents synthesis of inputs U.S. Drought Monitor. Most direct impacts on water supply (and demand), agriculture, fire risk. But manifold indirect impacts as well, e.g., on recreation, energy production, water quality, air quality, ecosystems, endangered species.
Current Crop Moisture Index (for period ending 7/26/2003) Current CMI
Current Palmer Drought Severity Index (for period ending 7/26/2003) Current CMI
Current Drought Monitor (7/22/2003) U.S. Drought Monitor - current.
Drought Monitoring - take home points Take home points - monitoring • There is no unique definition of drought, nor is there a “best” drought index - all have strengths and limitations. • Consider impacts - the “human dimension”. • Keep in mind the types of drought, and their lag relationships. • Be wary of calling a premature end to the drought; hydrological impacts may persist well after precipitation has returned to near normal. • Key factors to monitor in drought include severity, longevity, spatial pattern and scale. Impacts will vary regionally and depending on time of year. • There are a number of excellent web resources available.
Drought monitoring - some key resources Monitoring -Key web resources. • Climate Prediction Center - http://www.cpc.ncep.noaa.gov/ • NDMC - http://www.drought.unl.edu/index.htm • Climate Diagnostics Center - http://www.cdc.noaa.gov/ • Western Region Climate Center - http://wrcc.sage.dri.edu/
Drought causes - intro. Drought Causes You are asked, “ What is the cause of this drought?” And your answer is …
Anticyclone effects “An unusually persistent upper-level ridge over the region….” • General contributing factors are:anomaloussubsidence, changes in horizontal moisture transports, and shifts in the storm tracks. • Persistent upper-levelridges are often identified as the proximate cause of drought conditions.Subsidence occurs downshear of ridge axis. Suppresses precipitation in several ways: • Adiabatic warming inhibits large-scale condensation • Mid-tropospheric warming produces static stabilization • Low-level divergence inhibits moisture convergence, is frontolytical. • Even relatively weak subsidence can strongly suppress precipitation.
Role of Moisture transports Role of Anomalous Moisture transports: 1988 Drought 850 mb Mean Moisture Flux (April - June) 850 mb Anomalous Flux (April-June, 1998) (from Lyon and Dole, 1995)
What causes the anticyclone? Next question: What is the cause of this unusual flow pattern?
Drought causes - spatial patterns An important diagnostic clue: spatial pattern The 1998-2002 drought was part of a larger global pattern.
Perfect Ocean for Drought During the same time - persistent tropical SST anomalies Pacific sea surface temperature on the equator, 1998-2002 Unusual warmth of the “warm pool Multi-year La Niña since 1998
La Nina impacts La Niña Effects on U. S. Precipitation La Niña Composite (Oct.-May) (created off of CDC web site) La Niña’s effects on precipitation are most robust in SW and SE.
Oct.-May P-T anomalies U.S. Oct-May Precipitation and Temp Anomalies Averaged for the Period 1998-2002 TemperaturePrecipitation >+2°F <-5” <-10”
Simulating Joint Impacts Idealized experiments to test sensitivity to tropical SSTs (Hoerling and Kumar, 2003) Simulating the Joint Impacts of Warm Indian Ocean and La Niña U.S. Oct-May Temperature And Precipitation Temperature Precipitation <-7” >+3°F
Observed and AGCM anomalies - specified SSTs(Hoerling and Kumar, 2003) Observed Temperature and Precipitation anomalies (June 1998 - May 2002) Model-simulated Temperature and Precipitation Anomalies given observed SSTs over this period
Land Surface Intro. Land Surface effects • Why consider? • Like SSTs, LS has a “memory” beyond synoptic scales • After SSTs, it is most likely source for seasonal climate predictability. • Influence on T • Influence on P
Role of land surface processes Drought changes evapotranspiration rates (ET) Example: Southern Plains, Summer 1980 drought (Lyon and Dole, 1995) ET decreases during drought. Estimated anomalous heating rates: +1-2 C/ day. Increases likelihood of heat waves. High T’s increase drought impacts (demand side).
Role of land surface processes - P LS effects on precipitation • Studies suggest a link between precipitation and anomalous LS conditions, especially for major droughts and floods, such as 1980, 1988 droughts, 1993 floods. • LS conditions do not initiate droughts. They may perpetuate drought conditions, increase the likelihood of drought recurrence (midwest), and certainly increase drought impacts. • Main LS effects on p are likely to be in warm season. • Mechanisms are elusive: local moisture recycling, non-local effects. • Non-local effects: T’ induces PV’: flow, moisture transport, convergence,stability change; changes in the elevated mixed layer.
Varying effects of remote forcing during drought Effects of remote and local land surface processes likely vary during droughts Studies of various droughts, and mechanistic experiments suggest that the role of remote and land surface processes varies during the course of drought evolution. (From Hong and Kalnay, 2002, for 1998 drought)
LS effects: Summary Take home points - LS processes • LS processes directly impact weather and climate through the surface heat and moisture budgets. ET is the key connecting variable, and is strongly modulated by soil moisture. At present ET is poorly observed; is estimated from models. • The strongest and most direct LS impacts are on T, through changes in the surface energy budget. Impacts on P are weaker, and may be due to local moisture recycling or more subtle non-local effects. • LS climate influences are most evident in warm season, when dynamics are relatively weak. LS processes are likely increase the probability of summer heat waves and may increase the duration of droughts. • Regions that are characterized by large soil moisture variance, high ET rates, and a dominance of convective precipitation are most likely to be sensitive to LS processes (e.g., much of the southern and central U.S. in summer). • There is increasing evidence that deep soil moisture may be significant in maintaining multi-year droughts over the Great Plains (e.g., in the 1930s).
Other factors Other factors • Random component - “droughts happen”. • Forcing from other ocean regions (extratropics, Atlantic) • Other large scale modes of variability (AO?) • Solar variations
Other factors The “Climate - Weather” Connection Understanding the links between “climate” and “weather” (precipitation) variability is vital to identifying the causes of droughts. • To understand droughts, need to understand dominant regional and seasonal precipitation mechanisms (synoptic-scale, convective, orographic --) • As droughts evolve, they may have feedback effects on T and precip., both locally and non-locally, that effect the weather: - T: higher maxs., larger diurnal cycles - - P: “In times of drought, all signs of rain fail.” May see higher convective cloud bases, other effects.Non-local effects; e.g., on dryline, convective cap locations? Possible development of biases in MOS wx. products?
Take home points - Causes of Drought Take home points - Drought Causes • To understand droughts, it is vital to know the processes that produce precipitation and how they are influenced by climate variability. This will vary regionally and seasonally. • Time scales and spatial patterns provide important clues on drought causes. • Several factors are likely contribute to severe and sustained droughts, such as tropical SST forcing, land surface processes, etc. Major factors contributing to the 1998-2002 drought were the persistent La Niña conditions and a record warmIndian Ocean.
Causes of drought - key web resources Causes of drought -Key web resources. • Climate Prediction Center - http://www.cpc.ncep.noaa.gov/ -- See expert assessments, discussions, long-lead briefings, etc. • Climate Diagnostics Center - http://www.cdc.noaa.gov/ -- Applications of diagnostic tools for interpretations.
Drought Prediction Drought predictions - basis For operational purposes, the drought prediction problem is to forecast the probability distribution of some quantitative drought measure or index over a given region and time period. Relationship to other operational products: • Very short term - apply weekly outlooks and hazards assessments. • CMI responds relatively rapidly - weekly to monthly forecasts relevant. • PDSI responds slowly - monthly to seasonal and longer - seasonal forecasts. • Consider T forecasts as well as P forecasts.
El Nino vs. La Nina Key point: Climate forecasts are always probabilistic. Model-derived Seasonal Precipitation probabilities for New Mexico La Niña El Niño The model results illustrate how “wet” La Niña conditions or “dry” El Niño conditions in New Mexico are both possible, but unlikely.
Extreme event risks Empirical estimates of changes in risks of seasonal precipitation extremes March-May (constructed from CDC website: http://www.cdc.noaa.gov/Climaterisks/) El Niño La Niña
Drought predictions - outlook Drought Outlook The current drought outlook (Climate Prediction Center):
Take home points Drought prediction - take home points • Climate forecasts are intrinsically probability forecasts. • Beyond a few weeks, the major source for predictive skill is related to changes in the distribution of tropical heating, particularly over the Pacific and Indian Oceans. Most models do not simulate this well. • Users are interested in weather/climate information and predictions across a broad range of time scales. For up to a few weeks out, use model forecasts (consider ensembles, not just control) plus CPC’s hazard assessment product; CMI (ag. impacts) responds on these time scales. • For longer-term conditions, use Drought Outlook and monthly and seasonal forecasts. Look at IRI and CDC’s experimental forecast pages to compare similarities and differences among seasonal forecast models.
Drought prediction - key resources Causes of drought -Key web resources. • Climate Prediction Center - http://www.cpc.ncep.noaa.gov/ Hazards assessment, monthly and seasonal forecasts, drought outlooks, experimental prediction of PDSI, etc. • International Research Institute for Climate Prediction (IRI) - http://iri.ldeo.columbia.edu/ • Climate Diagnostics Center - http://www.cdc.noaa.gov/ Experimental forecast products week two to multi-season, model-intercomparisons, ENSO-extreme event risks, etc.
The End The End