Download
1 / 38
380 likes | 557 Views
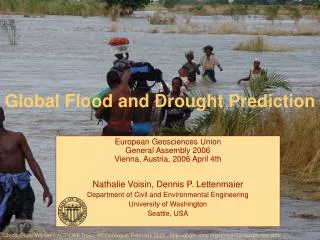
The Science of Drought and Flood Prediction. Anthony R. Lupo Department of Soil, Environmental, and Atmospheric Science. Introduction.

E N D
The Science of Drought and Flood Prediction Anthony R. Lupo Department of Soil, Environmental, and Atmospheric Science
Introduction The summer of 2012 in Missouri was very dry and hot. The mean summer season temperature ranked only about sixth warmest across our region. (26.9o C or 80.3o F in Mid-MO). (behind 1934, 1936, 1980, 1954, 1901). Precipitation – ranked as only the 10th driest summer thanks to a last second reprieve from Isaac with 145.3 mm (5.72”) (June 1 – August 31).
Introduction How last minute?
Introduction If we combine temperature and precipitation rankings EVEN WITH Isaac, 2012 is the 4th worst summer behind 1936, 1980, and 1901. (Remove Isaac and 2012 surpasses 1901). Nation-wide, the drought had severe impacts all across the economy.
Introduction From the US drought monitor: (Aug 28th, 2012) (http://droughtmonitor.unl.edu)
Introduction From the US drought monitor: (February 19th, 2013) (http://droughtmonitor.unl.edu)
Introduction Drought, or flooding such as experienced in 1993 or 1995, generally do not happen quickly. These take months to build up to and months to dissipate (2012 – go back to summer 2011). “Flash drought” can happen quickly and be quite severe. (e.g., Russia 2010). We’ll deal with this later.
Definition Drought - Basic drought equation: precipitation minus evaporation If evaporation exceeds precipitation for a period of time, the result is a drought. Meteorological drought compares P-E to climatology
Definitions Different types of drought Meteorological precipitation versus normal Agricultural stress on plants Hydrological level of the rivers and lakes
Meteorological Situation 500 hPa ridge amplified over the central USA (1 June – 31 Aug, 2012)
Meteorological Situation • Summer 500 hPa and 850 hPa maps (from Lupo et al. (2012)) 1970 (dry – 9.63) 2001 (normal) 1976 (driest) EN -> LA Neu -> Neu LN -> weak EL
Drought in the Midwest The impact of El Nino. El Nino, what is it? El Niño –means literally “the child”, in this case, THE Child as El Niño typically sets in around Christmas on the coast of South America!
Drought in the Midwest El Niño (or ENSO – El Niño and Southern Oscillation) is the generic term referring to the see-saw of warm (El Niño) and cold (La Niña) sea surface temperature patterns in the eastern Tropical Pacific This occurs every 2 – 7 years!
Drought in the Midwest El Nino:
Drought in the Midwest Currently: (ENSO-neutral) (Source: Climate Prediction Center)
Drought in the Midwest Forecasts persist in projecting neutral conditions for the rest of the year and range from weak La Nina to weak El Nino conditions.
Drought in the Midwest Ratley (Ratley, Baxter, Lupo) et al. 2002 discussed the onset of the summer regime in the mid-west and it’s relation to ENSO. They noticed that before the summer regime becomes “established”, significant rains (widespread and more than 0.25 inches) fall on average every 7 days. This becomes every 12 days after the onset of the summer pattern.
Drought in the Midwest They then found that in summers involving the transition into a (future) El Nino situation, the mean precipitation frequency in spring and summer is 6 days and 10 days, respectively. (e.g., summer 1993, summer 2004) For the transition into a La Nina situation, the corresponding numbers are 8 days, and 19 days, respectively. (e.g., summer 1983, 1988, 1999, 2005, 2012 and historically, the severe dry spell of the 1950’s)
Drought in the Midwest Thus, they found that in the Missouri region, there is not a significant difference region-wide in precipitation amounts year-to-year, but the frequency of heavy precipitation is markedly different. (exceptional years it may be less or more as well). It is well-known in the agricultural community that lighter, more frequent (regular) precipitation events are much better for crops.
Drought in the Midwest The results of Ratley et al. (2002) are based on 30 years worth of data. Results from this extended work (Birkand Lupo (2010) paper) support the results given here. Currently working on a similar analysis for Western Russia. Results demonstrate that ENSO transition is correlated with drought there as well (Lupo et al., 2012, conference paper).
Drought in the Midwest What is the role of climate and climate change on drought? Let’s look at the decadal record for the USA. We had drought years in this part of the country during the 1910’s 1930s, 1950’s, 1980, 1983, 1988, 1999, 2003, 2005, 2012 (but wet years in 1993 and 1995).
Drought in the Midwest Borrowed from Karl and Knight (1998), BAMS Borrowed from Hu et al. (1998), BAMS
Drought in the Midwest Climate change may impact the temporal and/or spatial distribution and severity of drought, however, drought and pluvials (wet spells) will still occur. Let’s look at a couple centuries…….
Drought in the Midwest • Borrowed from the Missouri Tree-Ring Laboratory • Stambaugh, M.C. and R.P. Guyette. 1000 years of tree-ring reconstructed drought in the Central United States.
Paleoecological understanding 1816, Year without summer 16th Century Megadrought Dust Bowl Maunder Minimum Medieval Warm Period Little Ice Age Stambaugh, M.C. and R.P. Guyette. (in prep). 1000 years of tree-ring reconstructed drought in the Central United States.
Drought in the Midwest Borrowed from Fye et al. (2003), BAMS
Drought in the Midwest Precipitation in the Northern Plains (Borrowed from Woodhouse and Overpeck, (1998), BAMS
Drought in the Midwest Studies have shown that the US climate has been getting wetter. What does the future hold? Model studies have shown our region may be drier (e.g., IPCC), and some studies have shown it may be wetter (e.g. Semenov et al., 2003, Climate Dynamics).
Drought in the Midwest Many regions of the country give similar mixed results, but since drought and wet spells are seasonal in nature (and driven by SST and atmospheric variations) they will continue to occur regardless of what the climate does!
Forecast 2013 What’s in store for 2013?
Forecast 2012 Our group predicted a relatively dry and warmer than normal summer 2012 regionally based on a few factors. 1) For 6 of the past 12 months before there had precipitation amounts below to well-below normal (4), while four months have been very wet. Winter and spring temps were well above normal though.
Forecast 2012 2) During the late winter, early spring, weak La Nina conditions persisted in the eastern tropical Pacific. At the time, this was expected to persist through the spring and summer. 3) we’d also projected a drier spring, which did occur. The late spring/early summer (June) were in-line with our predictions.
Winter 2012 - 2013 (Mid MO) Predictions were for a warmer than normal winter, and drier than normal with precipitation and less snow than normal. http://weather.missouri.edu/gcc/ For December, we’re warmer than normal, a bit dry with less snow than normal. A decent forecast (so far….) on our part!
Spring 2013 Spring Temps – March April May
Spring 2013 Spring Precipitation: March April May
Summer 2013 CPC Summer temps - JJA
Summer 2013 CPC Summer Precipitation
Summer 2013 CPC forecast is for a warm summer, with the inference that the later summer will be cooler. This may reflect the ENSO neutral conditions? No precipitation forecast. They always punt! Famous “double header” dry summers: 1916 – 1917, 1953 – 1954, 1971-1972.